---
title: Observability for User Apps
layout: docs
nav: guides
date: 2025-05-26
---
<figure>
<img src="/static/images/observability.png" alt="Illustration by Annie Ruygt of a printed photo depicting a bird and a ghost backpacking through a forest" class="w-full max-w-lg mx-auto">
</figure>
## Overview
When you run a platform for users to execute their own code on Fly.io—[think per-user development environments](/docs/blueprints/per-user-dev-environments/) or AI/LLM apps—it's a good idea to have real-time observability for those user apps. You might _also_ want to stream logs from those apps back to the original developer (your end-user), so they can see what their code is doing.
Fly.io offers built-in telemetry based on [**NATS**](https://nats.io/) that you can tap into to achieve this. At a high level, Fly.io captures everything your app writes to stdout and funnels it into an internal NATS log stream. A proxy in front of this NATS cluster ensures that each organization can only access its own applications' logs. Both the `flyctl logs` command and the our web dashboard's "Live Logs" use this pipeline under the hood. We can use the same system! By connecting a NATS client within your Fly organization's [private network](/docs/networking/private-networking/), we can subscribe to log subjects and stream logs out to wherever we need, in real-time.
## Deploying the Fly Telemetry Forwarder
If you want a bird's‑eye view for your own operations team, Fly provides an open source reference app called [**fly-telemetry**](https://github.com/superfly/fly-telemetry) that you can deploy to quickly get an observability stack running in your Fly organization. This app acts as a telemetry forwarder: it subscribes to the platform's NATS logs (and metrics) streams and stores the data for you. It includes a lightweight time-series database (VictoriaMetrics for metrics, VictoriaLogs for logs) and a Grafana instance with pre-configured dashboards, so you can explore your apps' logs and metrics visually.
In an empty directory, run:
```console
fly launch --from https://github.com/superfly/fly-telemetry \
  --yes \
  --copy-config \
  --org "$ORG" \
  --env ORG="$ORG" \
  --secret ACCESS_TOKEN="$(fly tokens create readonly "$ORG")" \
  --flycast
```
After the deployment finishes, browse to the app's private URL [through WireGuard](/docs/blueprints/connect-private-network-wireguard/) or `fly proxy` and you have instant Grafana dashboards.
This is handy for SREs, but not necessary for your end‑users.
---
## Streaming Fly app logs to your end users
Streaming live logs straight to your users gives them insight into what their code is doing—developers see exactly what the runtime sees, in real time, without leaving your product or juggling extra tooling.
### Connecting to the NATS Log Stream
Every Fly organization has access to **NATS** which carries the logs for its apps. The server is available at the well-known address `[fdaa::3]:4223`. To connect to this endpoint, you must do so from within the Fly network—for example, from code running in a Fly app (like your telemetry forwarder or router) or from your local machine over a WireGuard connection.
Using the NATS JavaScript client, you could connect as follows:
```javascript
import { connect, StringCodec } from "nats";

const nc = await connect({
  servers: "[fdaa::3]:4223",
  user: "sandwich-expert",            // your Fly org slug (example)
  pass: process.env.ACCESS_TOKEN       // your Fly access token (read-only)
});

// Now nc is a NATS connection that can subscribe to log subjects.
```
### Authentication
When connecting from a Fly app in your org, you'll need to supply an access token. To generate one manually, run `fly tokens create readonly <org>` and store it as an app secrets. The NATS proxy will accept the token as the password and your org name as the username.
### Log Subjects and Filtering
Logs in the NATS stream are organized by **subject**. The subject format for Fly logs is:
```console
logs.<app_name>.<region>.<machine_id>
```
For example, if you have an application named `panini-786` and it's running in region `dfw`, you might see subjects like `logs.panini-786.dfw.d896d7c609dd68` (where `d896d7c609dd68` is the Machine ID). You can subscribe at varying levels of granularity using NATS wildcards:
| Subject Pattern | Description |
|----------------|-------------|
| `logs.>` | Subscribe to **all logs** from all apps in your org (every region, every Machine) |
| `logs.<app>.*.>` | Subscribe to all logs from a specific app (across all regions and Machine) |
| `logs.*.<region>.>` | Subscribe to all logs from a specific region |
| `logs.<app>.<region>.<machine>` | Subscribe to a single Machine (full exact subject) |
In practice, to stream all logs for a given user's app, you'll subscribe to the subject pattern `logs.<user-app-name>.>` – this will capture any log line from any Machine of that app, in any region.
### A Real-World Example
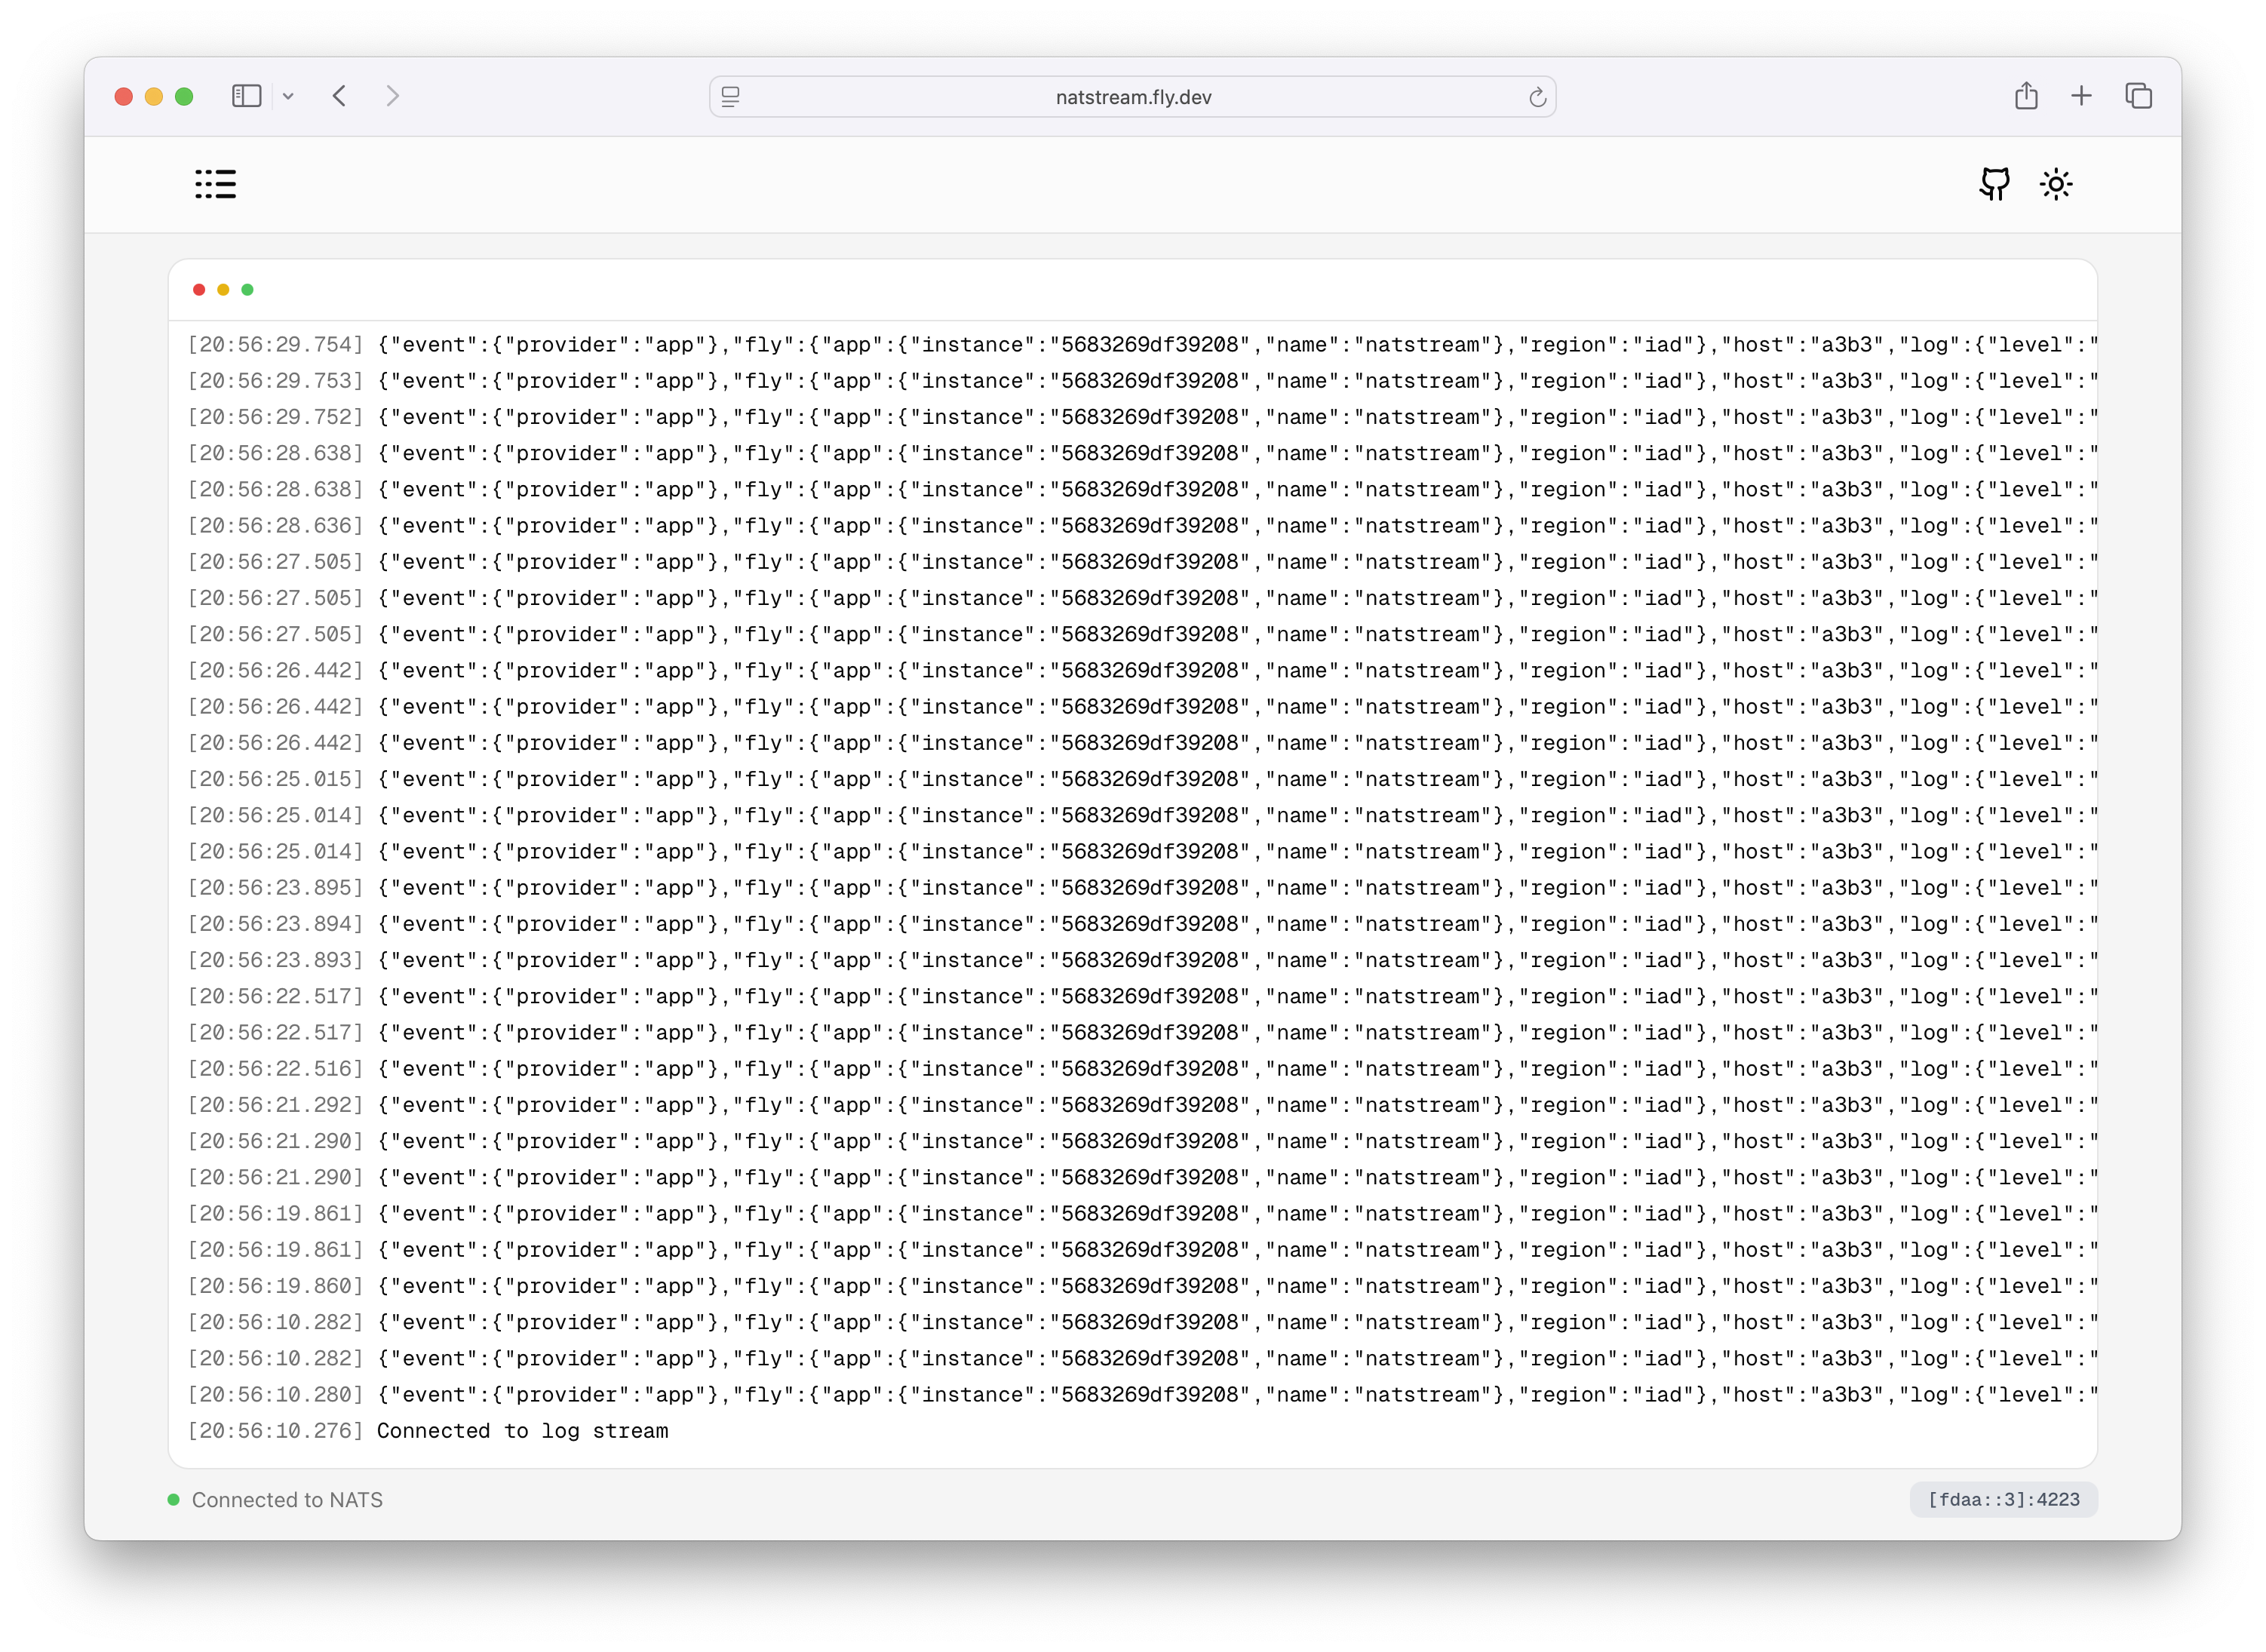
[**NATstream**](https://natstream.fly.dev/) is a reference app that streams logs from your Fly apps right back to the browser. It connects to NATS and turns those events into a live feed at a simple HTTP `/logs` endpoint using Server-Sent Events (SSE). Developers could log in to your product and watch their app's logs flow in real time, without needing separate logging tools or the Fly CLI. The app keeps things high-level and lightweight—there's no deep framework complexity here, just a straightforward example of hooking into Fly's log pipeline and broadcasting events to the browser.
<figure class="flex ai:center jc:center w:full r:lg overflow:off mb:4 rounded">
<img src="/static/images/natstream.webp" alt="Screenshot of the NATstream open source app UI" class="w:full h:full fit:cover">
</figure>
You can fork it as a foundation for your own developer-facing live log streaming service, or rip out the relevant parts and build this logic into your existing app, using the NATstream implementation as a guide. More robustly, you could run a separate log "router" app that handles authentications and streaming on a per user, per app basis. This would be especially useful if streaming logs to a CLI.
---
## Building a Central Log Router Service
Create a Fly "log router" app that sits between Fly's NATS telemetry stream, your product and your developers. Because each customer already has their own Fly app, every user's logs appear on a unique subject (`logs.<app>.>`), so multi-tenancy is solved by design—subscribe only to the subject that matches the requesting developer's app and you'll never mix data between users.
<div class="note icon">
**Note**: Your router service should enforce that a user can only request the logs for the app(s) they own. This means your routing logic needs an access control check (e.g. based on the authenticated user's ID matching the app name or an internal mapping). Fortunately, if you've structured your platform as one Fly app per user, it's straightforward to maintain a mapping from user account to Fly app name and use that for authorization.
</div>
On startup the router opens one NATS connection with an org-scoped read-only token. When a developer signs in through your dashboard or CLI, the router authenticates that user, determines their Fly app name, and, if not already listening, subscribes to that app's subject. As log entries arrive, the router forwards them over a live channel—typically a websocket or Server-Sent Events stream—directly to the developer's browser or CLI.
The router itself is a Fly app that does the following:
- On startup, connect to the NATS log stream using the org-wide credentials (as shown earlier).
- Wait for developers to request or connect for log streaming (e.g., a developer opens a web UI to view their app's live logs, or runs a command to view logs).
- When a request for a specific app's logs is received, subscribe to that app's log subject (if not already subscribed).
- Stream the incoming log messages to the requesting developer in real-time.
- Ensure that each developer only receives their own app's logs. The router should use the mapping of app ← → user to publish the right data to the correct output channel (and not mix different users' data).
This approach uses one NATS subscription _per user app_. The messages are forwarded verbatim to the user's websocket in this case (as JSON strings), but you could transform them (for example, format them nicely or filter out certain internal logs) before sending. On the client side, you would simply read from the websocket or SSE stream and append new log lines to a console view.
## Related reading
- [Logging overview](/docs/monitoring/logging-overview/) How logs flow from your Fly apps into the platform’s NATS pipeline.
- [Logs API options](/docs/monitoring/logs-api-options/) Guide with approaches for tapping directly into structured logs programmatically.
- [fly-telemetry](https://github.com/superfly/fly-telemetry) Lightweight reference implementation for quick, out-of-the-box observability for deployments on Fly.io.
Observability for User Apps
Overview
When you run a platform for users to execute their own code on Fly.io—think per-user development environments or AI/LLM apps—it’s a good idea to have real-time observability for those user apps. You might also want to stream logs from those apps back to the original developer (your end-user), so they can see what their code is doing.
Fly.io offers built-in telemetry based on NATS that you can tap into to achieve this. At a high level, Fly.io captures everything your app writes to stdout and funnels it into an internal NATS log stream. A proxy in front of this NATS cluster ensures that each organization can only access its own applications’ logs. Both the flyctl logs command and the our web dashboard’s “Live Logs” use this pipeline under the hood. We can use the same system! By connecting a NATS client within your Fly organization’s private network, we can subscribe to log subjects and stream logs out to wherever we need, in real-time.
Deploying the Fly Telemetry Forwarder
If you want a bird's‑eye view for your own operations team, Fly provides an open source reference app called fly-telemetry that you can deploy to quickly get an observability stack running in your Fly organization. This app acts as a telemetry forwarder: it subscribes to the platform’s NATS logs (and metrics) streams and stores the data for you. It includes a lightweight time-series database (VictoriaMetrics for metrics, VictoriaLogs for logs) and a Grafana instance with pre-configured dashboards, so you can explore your apps’ logs and metrics visually.
After the deployment finishes, browse to the app’s private URL through WireGuard or fly proxy and you have instant Grafana dashboards.
This is handy for SREs, but not necessary for your end‑users.
Streaming Fly app logs to your end users
Streaming live logs straight to your users gives them insight into what their code is doing—developers see exactly what the runtime sees, in real time, without leaving your product or juggling extra tooling.
Connecting to the NATS Log Stream
Every Fly organization has access to NATS which carries the logs for its apps. The server is available at the well-known address [fdaa::3]:4223. To connect to this endpoint, you must do so from within the Fly network—for example, from code running in a Fly app (like your telemetry forwarder or router) or from your local machine over a WireGuard connection.
Using the NATS JavaScript client, you could connect as follows:
import{connect,StringCodec}from"nats";constnc=awaitconnect({servers:"[fdaa::3]:4223",user:"sandwich-expert",// your Fly org slug (example)pass:process.env.ACCESS_TOKEN// your Fly access token (read-only)});// Now nc is a NATS connection that can subscribe to log subjects.
Authentication
When connecting from a Fly app in your org, you’ll need to supply an access token. To generate one manually, run fly tokens create readonly <org> and store it as an app secrets. The NATS proxy will accept the token as the password and your org name as the username.
Log Subjects and Filtering
Logs in the NATS stream are organized by subject. The subject format for Fly logs is:
logs.<app_name>.<region>.<machine_id>
For example, if you have an application named panini-786 and it’s running in region dfw, you might see subjects like logs.panini-786.dfw.d896d7c609dd68 (where d896d7c609dd68 is the Machine ID). You can subscribe at varying levels of granularity using NATS wildcards:
Subject Pattern
Description
logs.>
Subscribe to all logs from all apps in your org (every region, every Machine)
logs.<app>.*.>
Subscribe to all logs from a specific app (across all regions and Machine)
logs.*.<region>.>
Subscribe to all logs from a specific region
logs.<app>.<region>.<machine>
Subscribe to a single Machine (full exact subject)
In practice, to stream all logs for a given user’s app, you’ll subscribe to the subject pattern logs.<user-app-name>.> – this will capture any log line from any Machine of that app, in any region.
A Real-World Example
NATstream is a reference app that streams logs from your Fly apps right back to the browser. It connects to NATS and turns those events into a live feed at a simple HTTP /logs endpoint using Server-Sent Events (SSE). Developers could log in to your product and watch their app’s logs flow in real time, without needing separate logging tools or the Fly CLI. The app keeps things high-level and lightweight—there’s no deep framework complexity here, just a straightforward example of hooking into Fly’s log pipeline and broadcasting events to the browser.
You can fork it as a foundation for your own developer-facing live log streaming service, or rip out the relevant parts and build this logic into your existing app, using the NATstream implementation as a guide. More robustly, you could run a separate log “router” app that handles authentications and streaming on a per user, per app basis. This would be especially useful if streaming logs to a CLI.
Building a Central Log Router Service
Create a Fly “log router” app that sits between Fly’s NATS telemetry stream, your product and your developers. Because each customer already has their own Fly app, every user’s logs appear on a unique subject (logs.<app>.>), so multi-tenancy is solved by design—subscribe only to the subject that matches the requesting developer’s app and you’ll never mix data between users.
Note: Your router service should enforce that a user can only request the logs for the app(s) they own. This means your routing logic needs an access control check (e.g. based on the authenticated user’s ID matching the app name or an internal mapping). Fortunately, if you’ve structured your platform as one Fly app per user, it’s straightforward to maintain a mapping from user account to Fly app name and use that for authorization.
On startup the router opens one NATS connection with an org-scoped read-only token. When a developer signs in through your dashboard or CLI, the router authenticates that user, determines their Fly app name, and, if not already listening, subscribes to that app’s subject. As log entries arrive, the router forwards them over a live channel—typically a websocket or Server-Sent Events stream—directly to the developer’s browser or CLI.
The router itself is a Fly app that does the following:
On startup, connect to the NATS log stream using the org-wide credentials (as shown earlier).
Wait for developers to request or connect for log streaming (e.g., a developer opens a web UI to view their app’s live logs, or runs a command to view logs).
When a request for a specific app’s logs is received, subscribe to that app’s log subject (if not already subscribed).
Stream the incoming log messages to the requesting developer in real-time.
Ensure that each developer only receives their own app’s logs. The router should use the mapping of app ← → user to publish the right data to the correct output channel (and not mix different users’ data).
This approach uses one NATS subscription per user app. The messages are forwarded verbatim to the user’s websocket in this case (as JSON strings), but you could transform them (for example, format them nicely or filter out certain internal logs) before sending. On the client side, you would simply read from the websocket or SSE stream and append new log lines to a console view.
Related reading
Logging overview How logs flow from your Fly apps into the platform’s NATS pipeline.
Logs API options Guide with approaches for tapping directly into structured logs programmatically.
fly-telemetry Lightweight reference implementation for quick, out-of-the-box observability for deployments on Fly.io.