

Fly.io converts Docker images to fast-booting VMs and runs them globally. Fly.io supports Laravel! Check us out.
Deploying an app to production may at the first few hours leave a sense of blindness on the state of our application. Questions like—Is every request going through smoothly? Will the servers suddenly run out of resource during some data crunching process?—run rampant like plaque in the back of our minds.
Often, we don’t get any indicator of frightening app-mishaps until we just do. Yikes!
Laravel Pulse is one of the Laravel ecosystem’s exciting new rollouts. It delivers a customizable dashboard of cards providing vital insights on application, queue, and server resource usage, as well as minute details on bottlenecks and exceptions.
Today, we’ll setup Laravel Pulse’s servers card in order to monitor and display resource usage of the Fly Machines running our Laravel app, and thankfully get visuals we can use to anticipate possible resource-mishaps event. Let’s get to it!
Prerequisites
Before anything else, we need our Laravel app deployed to a production environment. That can be quickly arranged by deploying it on Fly.io. This Laravel app should be connected to either a MySQL or Postgres database, as those are the only databases currently supported by Laravel Pulse.
Today we’re focusing on setting up our production application to use Pulse’s servers card feature. This means the Pulse package should also be installed into our app, with its configurable files made available( config, view, migration ) and its tables set up by publishing its assets and running the database migrations.
Finally, its viewPulse authorization gate should be defined so the route to the pulse dashboard, /pulse, is accessible even in production. Our definition of this gate would determine whether or not a logged-in user can view the Pulse dashboard.
With all the above are properly accommodated, we should be able to access our Pulse dashboard:
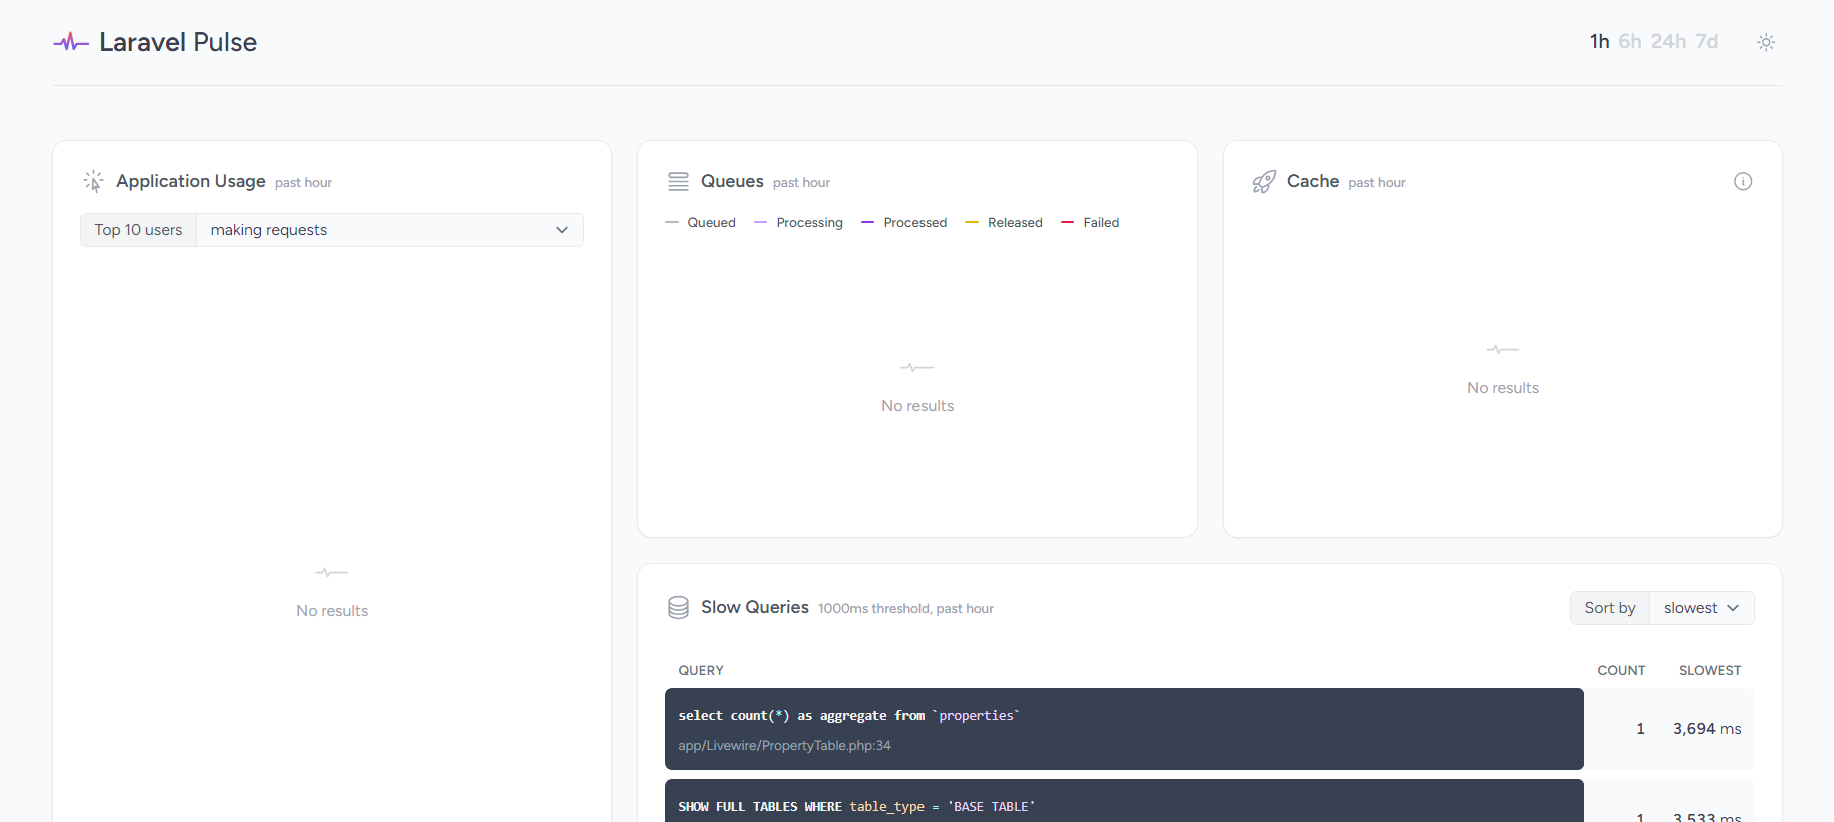
Focusing on the Servers Card
That’s a bunch of cards above! But we only need one today, and that’s Pulse’s servers card. Pulse allows us to customize its dashboard thanks to its publishable view asset. Go ahead and revise it to only include our servers card:
/*resources/views/vendor/pulse/dashboard.blade.php */
<x-pulse>
    <livewire:pulse.servers cols="full" />
</x-pulse>
Here’s how our dashboard should finally look like:
Aha! And now, our dashboard’s looking pretty desolate. But, that’s only natural. There’s no data yet for the servers card to display. We have to first capture entries for this card.
Servers Card
Before capturing data for our card to display, let’s take a detour and look into what this servers card is, and, why should we even care. To do this, we’ll start off at the architecture our Laravel application was deployed in.
The next Fly Machine paragraph is a courtesy of the lovely @XE! Check out their articles at our blog section—they’ve got some amazing GPU recipes cooking in there
See, a Laravel app deployed in Fly.io runs on Fly Machines—Firecracker VMs bootable-stoppable in sub-second speeds. They are fast to spin up, fast to tear down, and can even stop themselves when our app isn’t being used, so we can save the costs of those Machines when they aren’t needed. In fact, we can configure our application to spin up its own Machines with the Machines API, but, that’s a story for another day.
By default, when launching a Laravel app( any app really! ) in Fly.io, two Fly Machines are automatically created and allocated for the app. This is convenient: we have a second Fly Machine as backup and a partner to the first. It can receive requests just like the first one, effectively sharing requests and processing burdens with the first one, and, ultimately, acting as fallback in case the first suddenly becomes unavailable.
Now, how do these two Fly Machines tie back to the Pulse servers card? We have two Fly Machines running our app, we’d like to get a quick glimpse of each Machine’s resource usage, because how would we know whether one or, even both, are consuming too much memory, CPU power, or running out of storage?
This is exactly where Pulse’s servers card comes into play—to monitor and display Fly Machine resource usage!
Capturing Resource Usage with pulse:check
Now that we’ve got the “why” setup, it’s time to finalize our setup by capturing data entries for the card.
To capture entries, all we have to do is run php artisan pulse:check on each Machine running our app( remember, we have two! ) and our resource usage shall be good for recording. Once started, the pulse:check command perpetually runs and periodically dispatches a SharedBeat event.
The recorder for the servers card reacts to this event and records memory and CPU usage, and available storage.
Setting Up pulse:check on a Laravel Fly App
Since the pulse:check command runs perpetually once triggered, we only need to configure our Fly Machines to each trigger it once.
Setting that up is quite easy. See, during the time our app was initialized by Fly.io for deployment ( courtesy of fly launch ), a Dockerfile was auto-generated. This Dockerfile is used to setup the Fly Machine(s) that run our Laravel app.
This Dockerfile makes use of supervisor to run our app’s server. Thanks to this, we can use supervisor to handle running our pulse:check command as well. Simply create a new supervisor config file in the .fly directory generated by Fly.io, and configure it to run the pulse:check:
/* .fly/pulse-worker.conf */

[program:pulse-worker]
command=php /var/www/html/artisan pulse:check
autostart=true
autorestart=true
numprocs=1
redirect_stderr=true
stdout_logfile=/dev/stdout
stdout_logfile_maxbytes=0
stderr_logfile=/dev/stderr
stderr_logfile_maxbytes=0
stdout_events_enabled=true
stderr_events_enabled=true
user=www-data
Afterwards, update the autogenerated Dockerfile to copy this configuration into the /etc/supervisor/conf.d directory of our to-be Fly Machine:
## Dockerfile

/* OTHER PARTS OF DOCKERFILE HERE... */

+  # Setup CRON to update databases
+  COPY etc/pulse-worker.conf /etc/supervisor/conf.d/pulse-worker.conf

EXPOSE 8080
ENTRYPOINT ["/entrypoint"]
With those changes, push the changes to our Laravel Fly App by running fly deploy. Then behold, finally, a card to display resource usage of Fly Machines running our Laravel App:
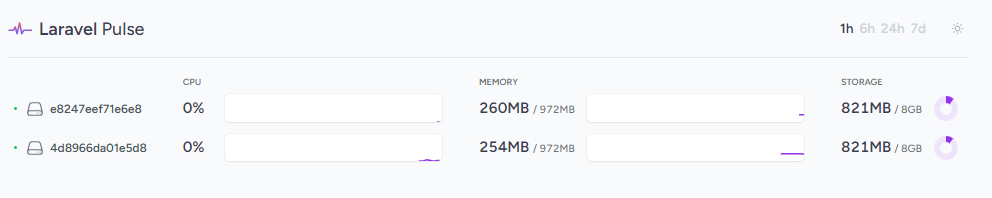
Since we have two Fly Machines running our Laravel app, two rows are present above. Notice the first column, these are the IDs of the Fly Machines running our app( each is the name retrieved by pulse:check from each machine ). The next three columns respectively display the CPU, Memory, and Storage allocations consumed by each Machine during the most recent run of the pulse:check command.
Fly.io ❤️ Laravel
Fly your servers close to your users—and marvel at the speed of close proximity. Deploy globally on Fly in minutes!
Deploy your Laravel app! →
Take Away
In just a few steps, we now have our very own Pulse dashboard, customized to display resource usage of our Fly Machines. All we needed to set up was running the pulse:check command through a supervisor config file, revise the Dockerfile auto-generated by Fly to include this config file to the configs supervisord would run in the Fly Machines running our app. And just with that, we’ve set up Pulse to capture resource usage for each Fly Machine running our Laravel app!