

This is a post about fixing a memory leak in our Rust-based proxy, fly-proxy. That’s the code that gets your users’ requests to the nearest VM that can fulfill them, on one of our servers in one of 21 regions worldwide. Take it for a spin by deploying an app in mere minutes.
We have a Rust-based proxy. It was leaking memory. We fixed it, and we’ll talk about that, but to be really thorough, we’ll look at how loading a web page works. Starting with hardware interrupts.
The downside of Thomas writing job postings is that they can turn out to have a great little primer on fly-proxy that we just have to link to, even though we are NOT hiring Rust devs at the moment.
Loading a web page — a journey
You type https://fly.io in your browser address bar and hit enter. What happens next?
First off, are you even using a keyboard? Not everyone can use a keyboard: voice input may be a suitable alternative there. Soft keyboards like the ones that pop up on mobile devices when you focus an input also don’t count — they’re software, like the name implies.
As keys get pressed, electrical contact is made between two conductive bits, which closes a circuit, and the microcontroller inside the keyboard (it’s computers all the way down) takes note and stuffs it in a buffer.
Back when you plugged in said keyboard, or, more likely, when your computer woke up and started enumerating USB devices, they entered a negotiation: the keyboard announced that it was HID class (for human interface device), and needed an “interrupt transfer” at a certain rate, and that’s the rate at which the computer will poll that device for…data.
(What about Bluetooth, proprietary wireless dongles, or even laptop keyboards? Chances are, these all end up being USB anyway, as far as your computer is concerned. Yes, even for internal devices. It’s just easier that way)
And then well, your computer does poll the device at the negotiated rate, and processes events in-order. So really, there’s no hardware interrupts involved.
(To be pedantic, because it’s that kind of article, your USB keyboard can actually interrupt the CPU, but that’s only so the BIOS can be driven by your keyboard. By the time a real operating system has been started up, that behavior has been overriden.)
Your operating system then does translation between scan codes (that depend on where the keys are located on the keyboard) and key codes, like “the letter A”. Then that goes through a bunch of event loops in the OS and your browser, and finally, we have https://fly.io somewhere in RAM.
So far so good.
And then, well, browsers are complicated beasts. If your browser is Chrome, then it checks some probabilistic data structure for safe browsing—if the domain is on the Bad List, then you get a scary page that tells you to click away! Now!
After that, or maybe in parallel, a DNS lookup happens, which translates the domain fly.io into an IPv4 and/or IPv6 address. This may happen over UDP, or it may happen over HTTPS! Or maybe it doesn’t happen, because it’s in the browser’s DNS cache, or the OS’s DNS cache, or your local router’s DNS cache. It’s caches all the way down, really.
If that succeeds, your browser tries to establish a TCP connection to that IP address. Because it’s an anycast IP address, packets get routed to an edge node nearby. For me that’s Paris, France. For my colleagues, it’s Toronto, Canada. Or South Africa, Brazil, the UK etc. It’s really quite the list.
(That’s assuming BGP routes are behaving that day. BGP is like DNS in that it’s always to blame somehow. It’s how different AS (autonomous systems), or peers inside the same AS, know where to send a packet next, so that it eventually reaches its destination.
When it works, it sends packets on…maybe not the best path, but a decent path. When the routes are wrong, it can send packets halfway around the world. And when it gets hijacked, well, it makes the headlines. Take notes, TV writers!)
It’s not like your browser crafts packets itself—that would let it spoof IP addresses, which is generally frowned upon. No, it asks the underlying operating system to please establish a TCP connection, and that sends a SYN packet.
(Technically it’s “a TCP segment with the SYN flag set, wrapped in an IP datagram, wrapped in an Ethernet frame”, but that doesn’t exactly roll off the tongue).
That packet goes on quite a journey.
It goes from userland to kernel space, out a NIC, shooting through the air, or through copper, then almost definitely fiber, crossing the land, maybe speeding through the ocean deep if you live too far from us—finally it enters a datacenter, a NIC, and the Linux kernel networking stack.
Therein lies our first bit of Rust: an eBPF program, built with aya.
Because our edge nodes have to listen on entire ranges of IPv4 and IPv6 addresses, and also all ports at the same time, we have a small program, loaded in the kernel, that decides whether the connection you’re trying to establish is allowed or not.
That’s all determined by the app configuration. In our fictional scenario, your browser is connecting to fly.io on port 443, and that’s a-ok. The TCP handshake completes, our second bit of Rust is ready to take over.
At first your connection sits in an accept queue, unless someone is flooding us with SYN packets, in which case there’s cookies involved, no, not that kind, and unfortunately not the tasty kind either.
We try to process that accept queue as fast as the CPU will let us, asynchronously with tokio, which really actually uses mio, which really “just” uses a kernel interface, in this case, epoll.
(In practice, this just means we can handle a lot of connections concurrently, with only a spoonful of OS-level threads. It’s all event-based and all the functions are state machines in a trenchcoat. It’s a whole thing.)
Because the Fly.io app has a TLS handler, your browser and fly-proxy engage in a multi-stage dance to establish a secure tunnel. Through that dance, we are able to prove that you are visiting the real Fly.io by presenting a valid certificate for it, signed by third parties that your OS trusts, and your browser does too.
Now that we’ve negotiated a secure channel, we’re ready to move on to more substantial exchanges.
Because you’re using a modern browser, it supports HTTP/2, and so do we, thanks to hyper. That means the exchange is all binary, and I can’t show what it would look like without whipping out some sort of protocol analyzer like Wireshark.
Any HTTP requests you send over that connection are handled by a tower service created especially for you, and of course there’s a bunch of concurrency limits involved: some set in the app configuration, and some global, just so everything stays nice and fast for everyone.
Because we occasionally need to look into how fly-proxy operates, or how a certain request was handled, a lot of internals are instrumented with tracing, which generates spans and log events that we funnel to a large store we can later query.
(We’re able to turn up the verbosity for single requests, which is what we do when you report a problem and we’re trying to reproduce it! There’s no special “debug” build of fly-proxy, it’s all dynamically configured.)
So we get your request, and if there’s an instance of the app running on the same node, we’re able to serve it directly. And if not, we proxy it to a nearby node that does have a running instance: taking into account things like the round-trip time to that node, and how busy it is.
Eventually, just as the request was, the response is proxied all the way back to your computer, your browser gets a bunch of HTML (maybe compressed, maybe not), and before it’s even done parsing it, it immediately fires up a half-dozen new requests, re-using the same connection.
And then we leak a bunch of memory.
What do you mean you leak a bunch of memory
Well, we used to!
It wasn’t, like, a lot. But it added up. That’s the thing with leaks: when request volume goes up, you expect resource utilization to go up, too. But when request volume goes down, and utilization doesn’t go down too, well…I mean that is an incentive to deploy often.
And it’s surprising! Because in languages with manual memory management, you can malloc and forget to free. You can new, and forget to delete.
But in Go for example, you can’t! Because there’s a garbage collector, which periodically runs, looks at all the stuff, and frees the stuff no one remembers. It’s just like in Coco (2017), except less sad.
Of course that’s a lie. Because it doesn’t look at all the things, it’s generational. And you can totally leak memory with a GC. All you need to do is stuff references to a bunch of big structs in a big map, and never take them out. That way they always remain reachable, are never collected, and memory usage goes weeeeeeeee.
As for Rust, it’s RAII-ish, so when you hold a value, it’s fully initialized, and when it falls out of scope, the associated memory (and any other resources) gets freed. And if that’s not enough, you can do reference-counting via Rc, or Arc if you need to share stuff across threads, and then you can have multiple things pointing to a single thing, which only gets freed when no things point to it any longer.
That scheme has different performance characteristics than a GC: the cost is more “spread out” (since stuff gets freed as soon as it’s no longer needed), there’s no pauses to worry about (even micro ones), people like it for real-time processing, high-performance network applications, and all sorts of other stuff.
Except there too, same deal: if you really try, you can leak memory in Rust. Don’t believe us? Lily says so too.
But we weren’t trying. And we didn’t really have an explanation we liked.
And historically, things haven’t been so good on that front: there’s two problems you really didn’t want to have when you had a big Rust async application in production:
- Something asynchronous is stuck somewhere
- You’re leaking some resources (probably memory)
The first got a lot better with the advent of tracing. You’re still not able to dump “all async stack traces” the way Go lets you, for example. Instead you instrument some code: here we’re establishing a connection, here we’re sending HTTP headers, and your downstream crates do too (like hyper), and then you’re looking at something a litlte more semantic than a stack trace.
But you also, still, can’t really dump it all. Something like tokio-console solves this and more, BUT it’s still early days, and not really something you can run in production today.
As for the second (leaking resources), I remember struggling with it just a year ago. Because allocations and deallocations are very fast and it’s all very nice, but there’s absolutely no one keeping track of where or why anything was allocated.
That wouldn’t be very zero-cost.
And yet, sometimes RAII fails you. Sometimes you just keep stuffing items into a Vec or a HashMap and never ever clean it up. The question is: where? And how are you going to find that out without exporting metrics for every last container type in your codebase?
Leak detectors have existed as long as we’ve had leaks. The remarkable Valgrind tool suite comes with MemCheck, which has a --leak-check option. But it checks for a lot of errors that simply can’t happen in safe Rust code, and makes your program run 20-30x slower, also using “a lot more memory”.
So, not an option for production web services.
In fact, if you’re writing a production network service, chances are you’ve switched away from the system memory allocator (glibc) to something like jemallocator, which, on top of being (sometimes) faster, is also less prone to fragmentation, and comes with a wealth of tools to monitor memory usage.
Including a heap profiler, which you can use to check for leaks. It feels like Go’s pprof, not a surprise since they’re both based on gperftools, which builds on the ideas in GNU gprof, in turn an extended version of the standard Unix prof tool.
But at the end of the day, you’re either looking at extremely long text output that doesn’t really have any temporal information, or a gigantic file PDF that makes you wish you had a trackball mouse handy.
Come for the Rust esoterica, stay for the hosting
It’ll take less than 10 minutes to get almost any container you’ve got running globally on our Rust-powered anycast proxy network.
Try Fly for free →
Enter bytehound
Bytehound is a memory profiler written in Rust, which works extremely well for Rust codebases (but, I’m assuming, C & C++ codebases too!). I had no hand in it — I just think it’s extremely cool.
For me, bytehound is the poster child for “NIH good? sometimes?”. Its custom stack unwinding implementation makes it orders of magnitude faster than competing tools. It’s designed to stream data to disk or over the network to some “gatherer” process, which means its impact in production is minimal.
(The non-NIH alternatives would be…something like heaptrack, Valgrind’s memcheck tool, one of the “checking” malloc implementations like Dmalloc, or even swapping malloc with an actual GC like Boehm.)
It’s all runtime instrumentation, too — I was able to inject it straight into my veins our production binary with LD_PRELOAD: no recompilation needed here. And it supports jemallocator!
In fact, of the whole hour I spent on this, 80% were spent fighting with the dynamic linker/loader itself. Normally, it lets you inject just about any library into any executable, as long as the bitness matches up and all the dependencies are satisfied.
But, in secure-execution mode:
LD_DEBUGis ignored (and so isLD_SHOW_AUXV)- Unless the file
/etc/suid-debugexists!touchdoes the trick.
- Unless the file
LD_PRELOADhas several limitations:- arguments with slashes are ignored (can’t preload
/tmp/libaww.so) - injected libraries must be SUID root
- arguments with slashes are ignored (can’t preload
So, long story short, moving libbytehound.so to a standard search path like /lib/x86_64-linux-gnu and invoking chmod u+s on it did the trick.
The last 20% was a breeze: by default, bytehound starts profiling immediately, writing to a .dat file on disk as it goes. I applied a touch of load with oha, another of my Rust favs, monitored memory usage in htop, it goes up, it goes up, it don’t go down, at least it’s easy to reproduce.
I then restarted fly-proxy (this is zero-downtime, never fear) opened the profile, and…no leaks.
Well, none that matter:
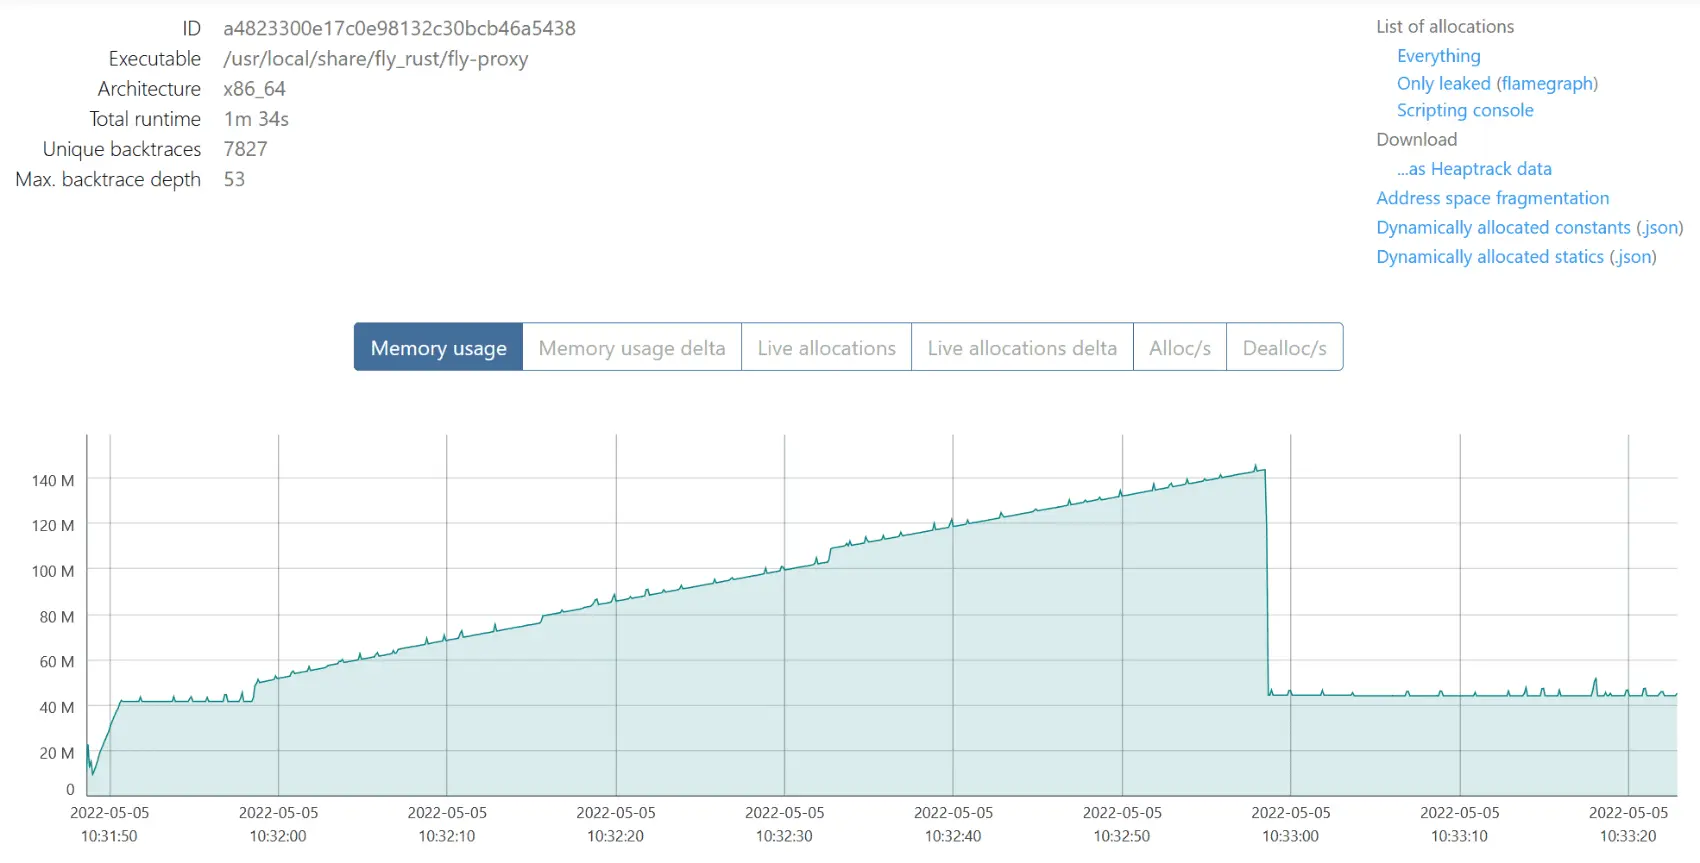
Restarting fly-proxy involves spinning up another instance, waiting until it’s ready to handle connections, then asking the previous instance to stop listening (then leaving it some time to handle established connections).
And the drop you can see right before 10:33:00 is when we stop listening: memory usage drops back to the ~40MB we use for internal state. According to bytehound, our inventory of nodes and services (and SQLite’s cache) are the only things we leak:
(Internal state on the left, SQLite mem cache on the right)
So RAII is working. And to be clear, I’m not really talking about the “by the time you hold a value of a given type, the associated resource is fully initialized” part, I’m talking about the “as soon as you let go of that value, associated resources get freed, too” part.
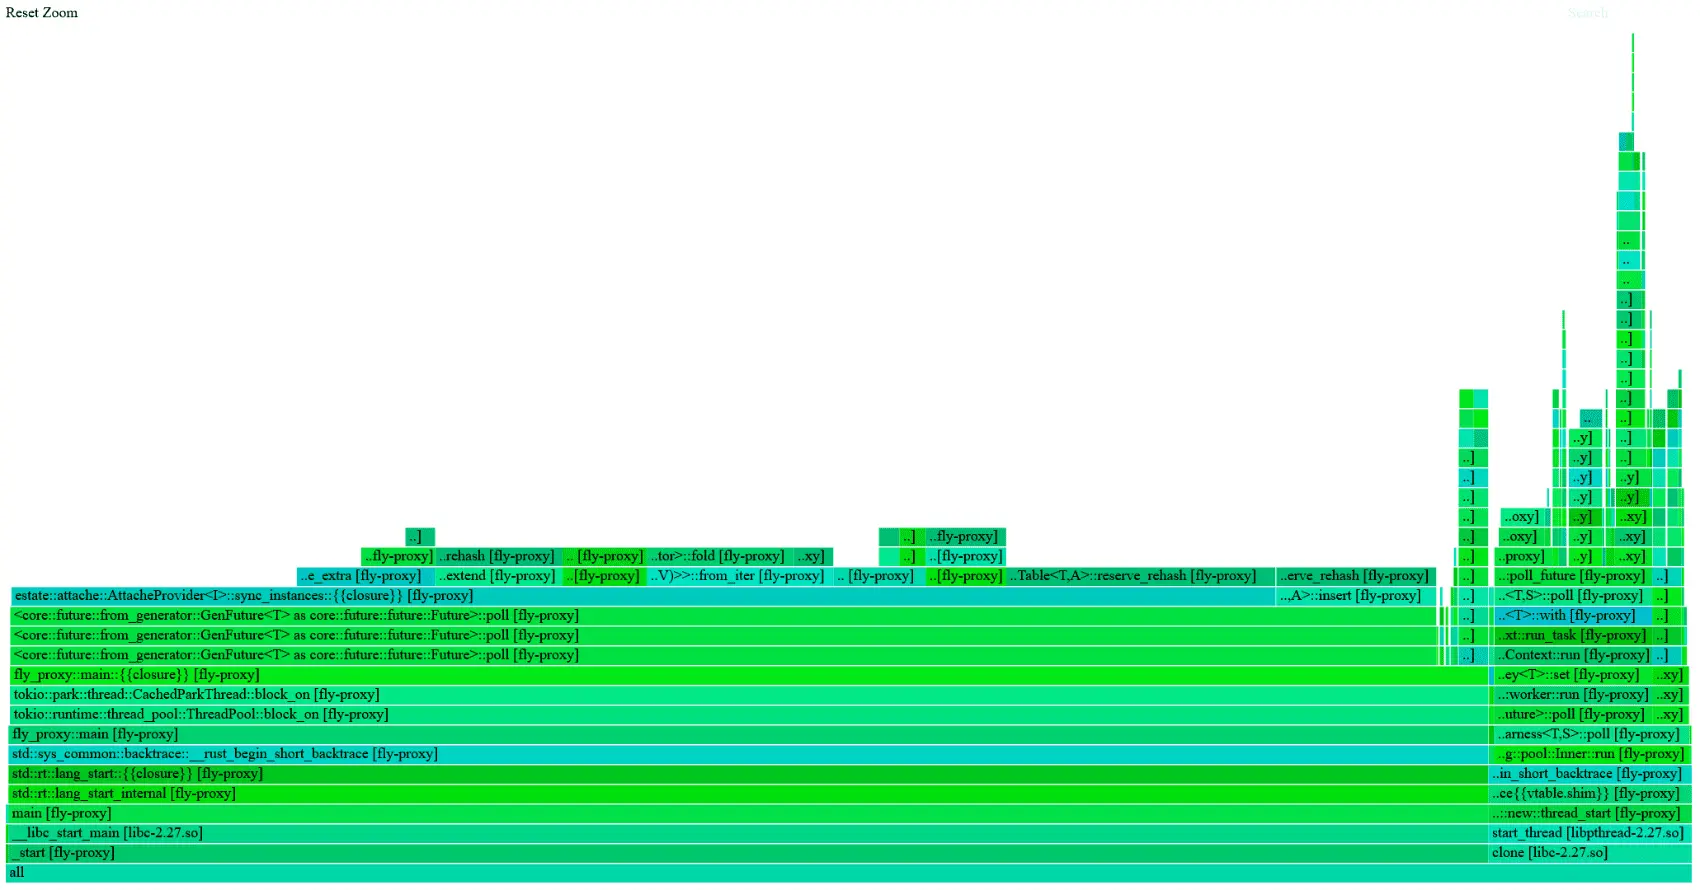
For my second try, I did…exactly the same thing, except I stopped profiling by sending SIGUSR1 before restarting fly-proxy, so that bytehound would consider anything that hadn’t been freed at that point leaked.

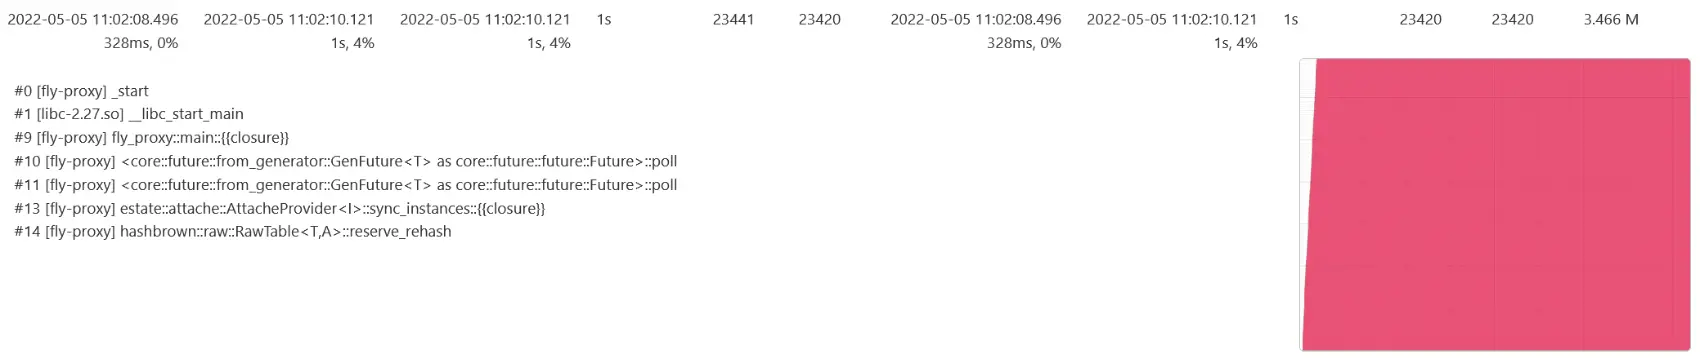
The “only leaked” flamegraph looks very different this time around:

Zooming in a little, we can see that almost all of it is allocated in fly_proxy::trace::honeycomb::HoneycombLayer:
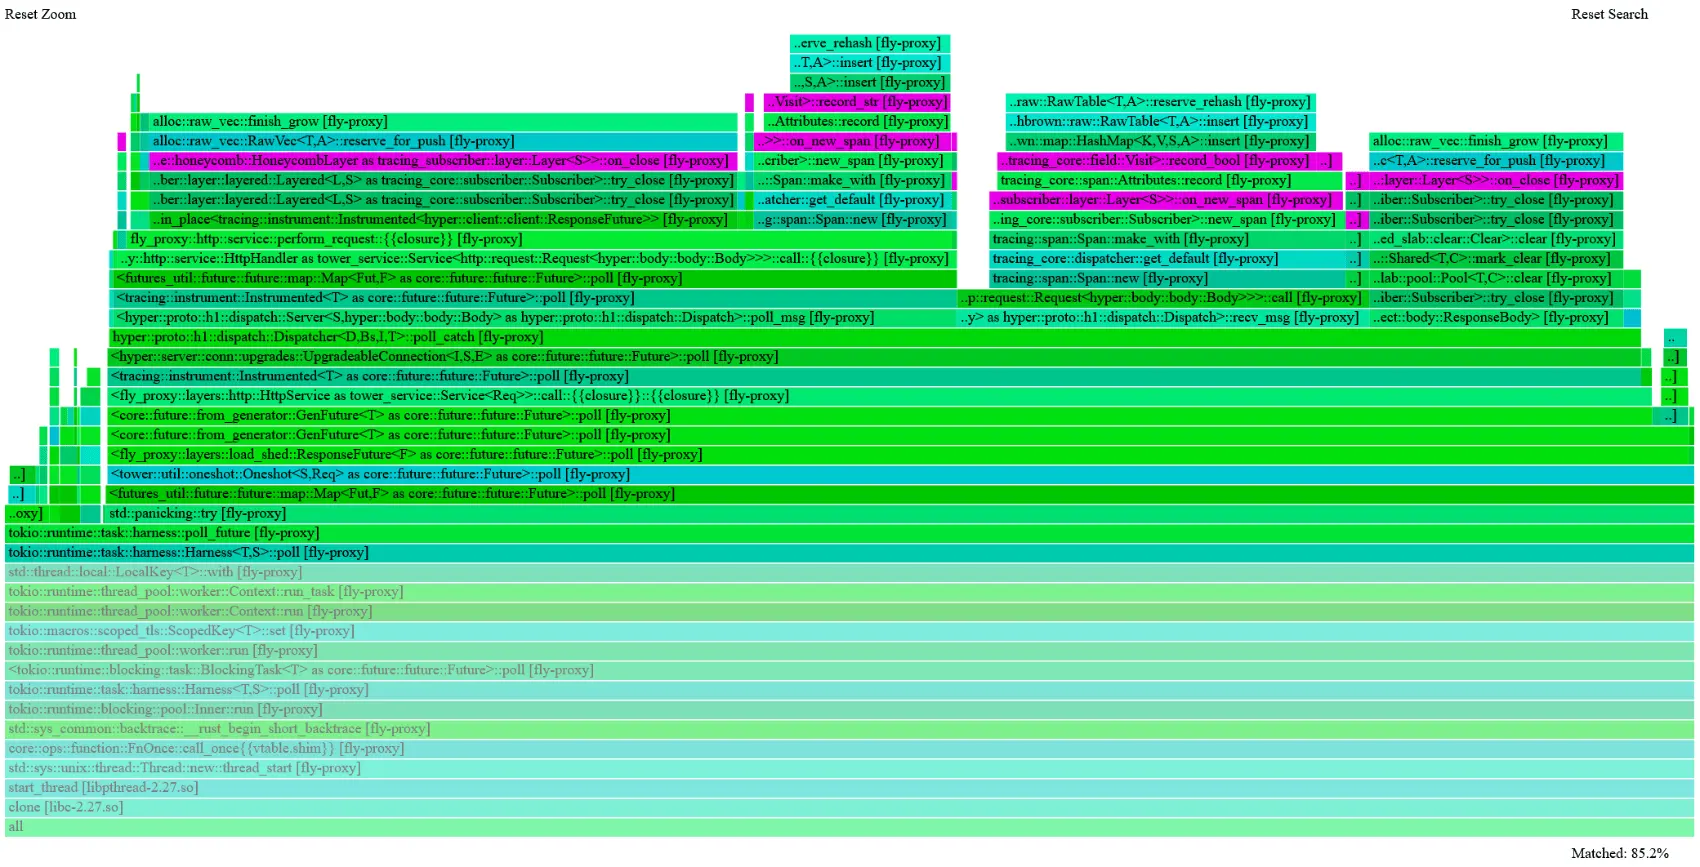
But that’s not even the best view of it: the bytehound UI lets you filter/sort allocations any which way you like. For example, we can ask for “only leaked”, grouped by backtraces, sorted by largest leak first, with graphs:
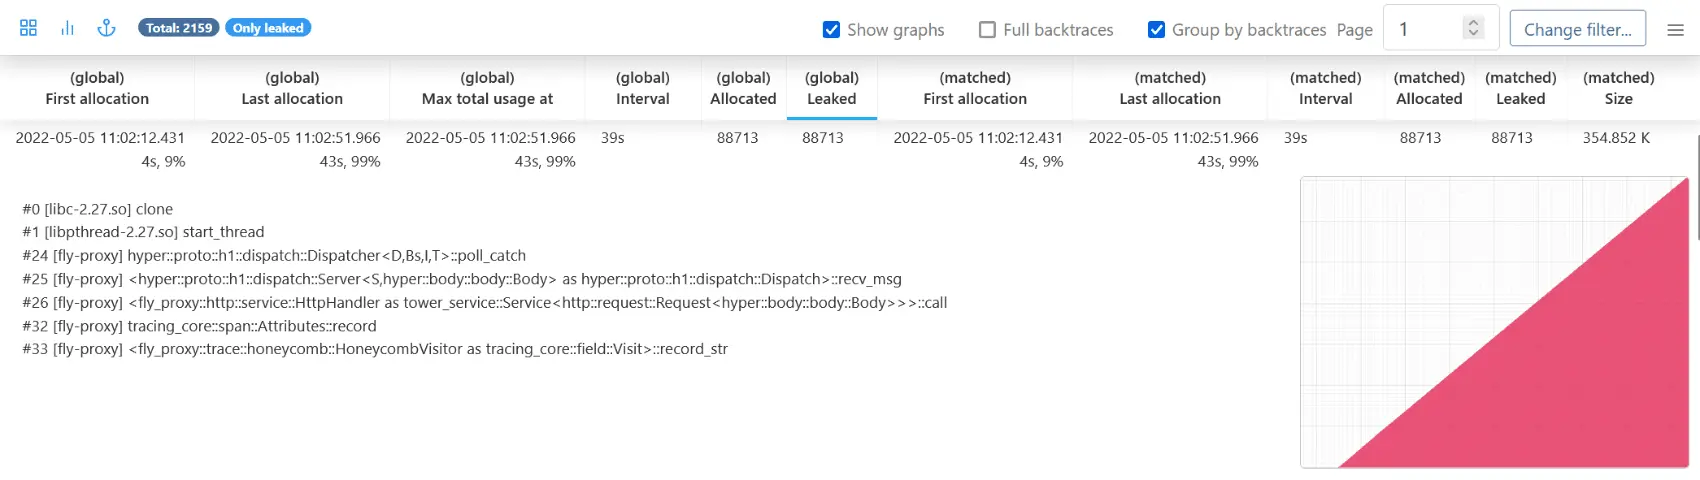
And seeing this, there’s no question. And there’s no distractions like in the flamegraph: the internal state we leak (because of background tasks we don’t cancel properly before shutting down — that one’s on me) looks very different:
That’s not the last of bytehound’s goodies: using just a little bit of rhai scripting:
let leaked = allocations().only_leaked();

graph()
    .add("HoneycombLayer", leaked.only_passing_through_function("honeycomb"))
    .add("all leaked", leaked)
    .save();
We can plot exactly the graph we want to see—here: does our HoneycombLayer account for most of the leak?

Yes. Yes it does.
Why though? A tracing primer
Let me first say: the leak wasn’t in any code provided by Honeycomb itself, or even any publicly available crate.
A long time ago, Fly.io’s traffic was low enough that we could afford to send some traces to Honeycomb.
(Or at least we thought we could, until Honeycomb emailed saying “hey, wtf!”. They have burst protection now; it was a different time.)
The tracing / OpenTelemetry ecosystem wasn’t as fleshed-out as it is now. So we had to write custom code. And I say we, but I wasn’t there.
When I started getting comfortable with fly-proxy‘s codebase, and after I was done making CI builds faster (switched linkers, split crates, adopted cargo nextest, set up incremental compilation caching, etc.), I noticed that custom HoneycombLayer code, and wanted to remove it, but after all, it wasn’t even exporting traces any more, so what harm could it do?
The way tracing works is that you can instrument functions: this opens and enters a span when the function is called, exits that span when the function returns, and, if nothing else refers to that span, the span is closed, and eventually exported somewhere nice.
It works almost the same way for async functions in Rust, except async functions are state machines that can be polled from any thread. So, the span is opened, and it’s entered+exited every time the async function is polled.
(Wait, polling? Yes, but only when there’s work to be done: some socket is ready to be read from / written to, some timer has elapsed, some lock has been acquired, etc.)
Each span has a name, a target, and a bunch of fields, which a good tracing platform like Honeycomb lets you use for filtering, sorting, heck, even monitoring. The duration of the span is tracked (from the time it’s opened to the time it’s closed), and when async functions are instrumented, we keep track of busy_ns too—how much CPU time we spent on it, and idle_ns—how long the task waited for something else to happen.
If you want to learn more about what Honeycomb feels like in conjuction with Rust tracing, I’ve written a whole thing about it recently.
Thing is, if you instrument your main function…well not that, but a similarly high-level function, like handle_incoming_connections, that span opens, is entered and exited a bunch of times, but never closes until you stop listening.
…sounds familiar?
And our custom, should-have-thrown-it-out-along-time-ago HoneycombLayer had something along the lines of: parent_span.children.add(span) whenever a span was closed. Which means every request was leaking a tiny bit of memory.
To reiterate: the issue was our own prehistoric Honeycomb tracer implementation, not Honeycomb. We love Honeycomb and OpenTelemetry at Fly.io.
When the proxy was restarted, that top-level task was “tripped”, exited, the associated span closed and freed, on some nodes, tens of gigabytes of memory — letting most heap profilers think everything was just peachy.
The PR to fix it was the most satisfying kind: sending old code into retirement.
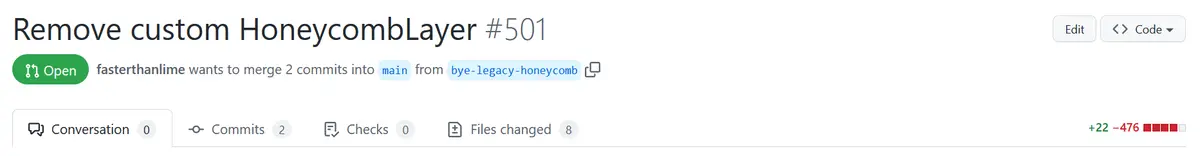
But did it fix the issue?
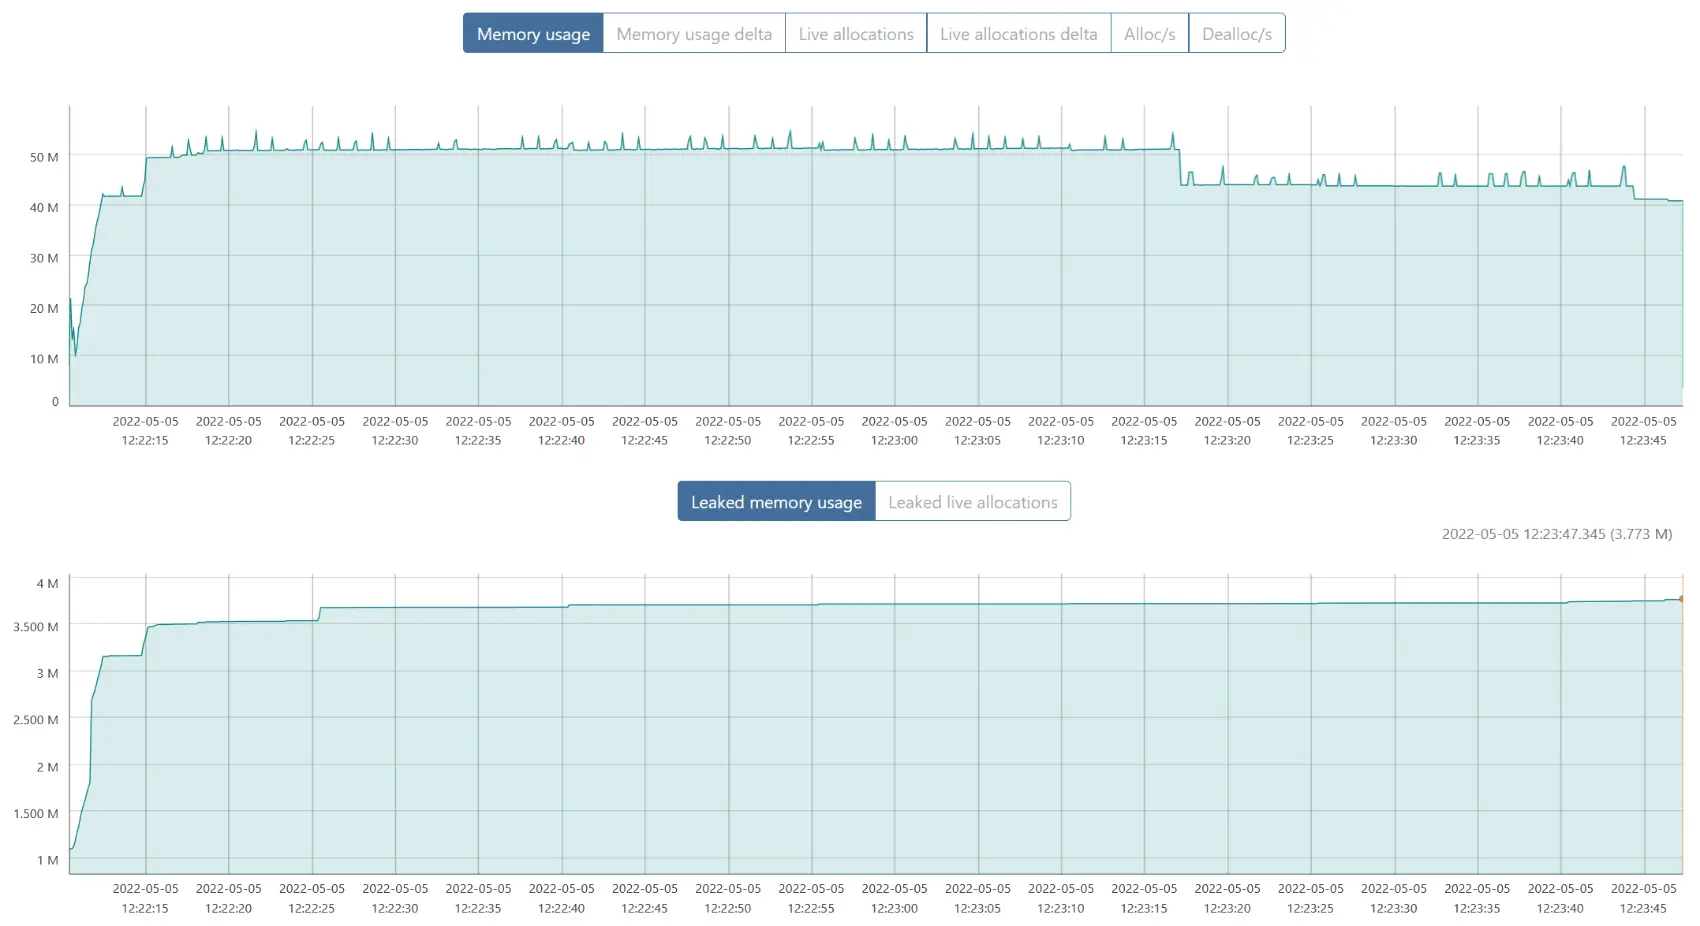
Absolutely. Memory usage barely went over 50MB during the load test.
What’s that? “Leaked memory usage” keeps growing ever so slightly? Let’s focus on the part where it seems stable:
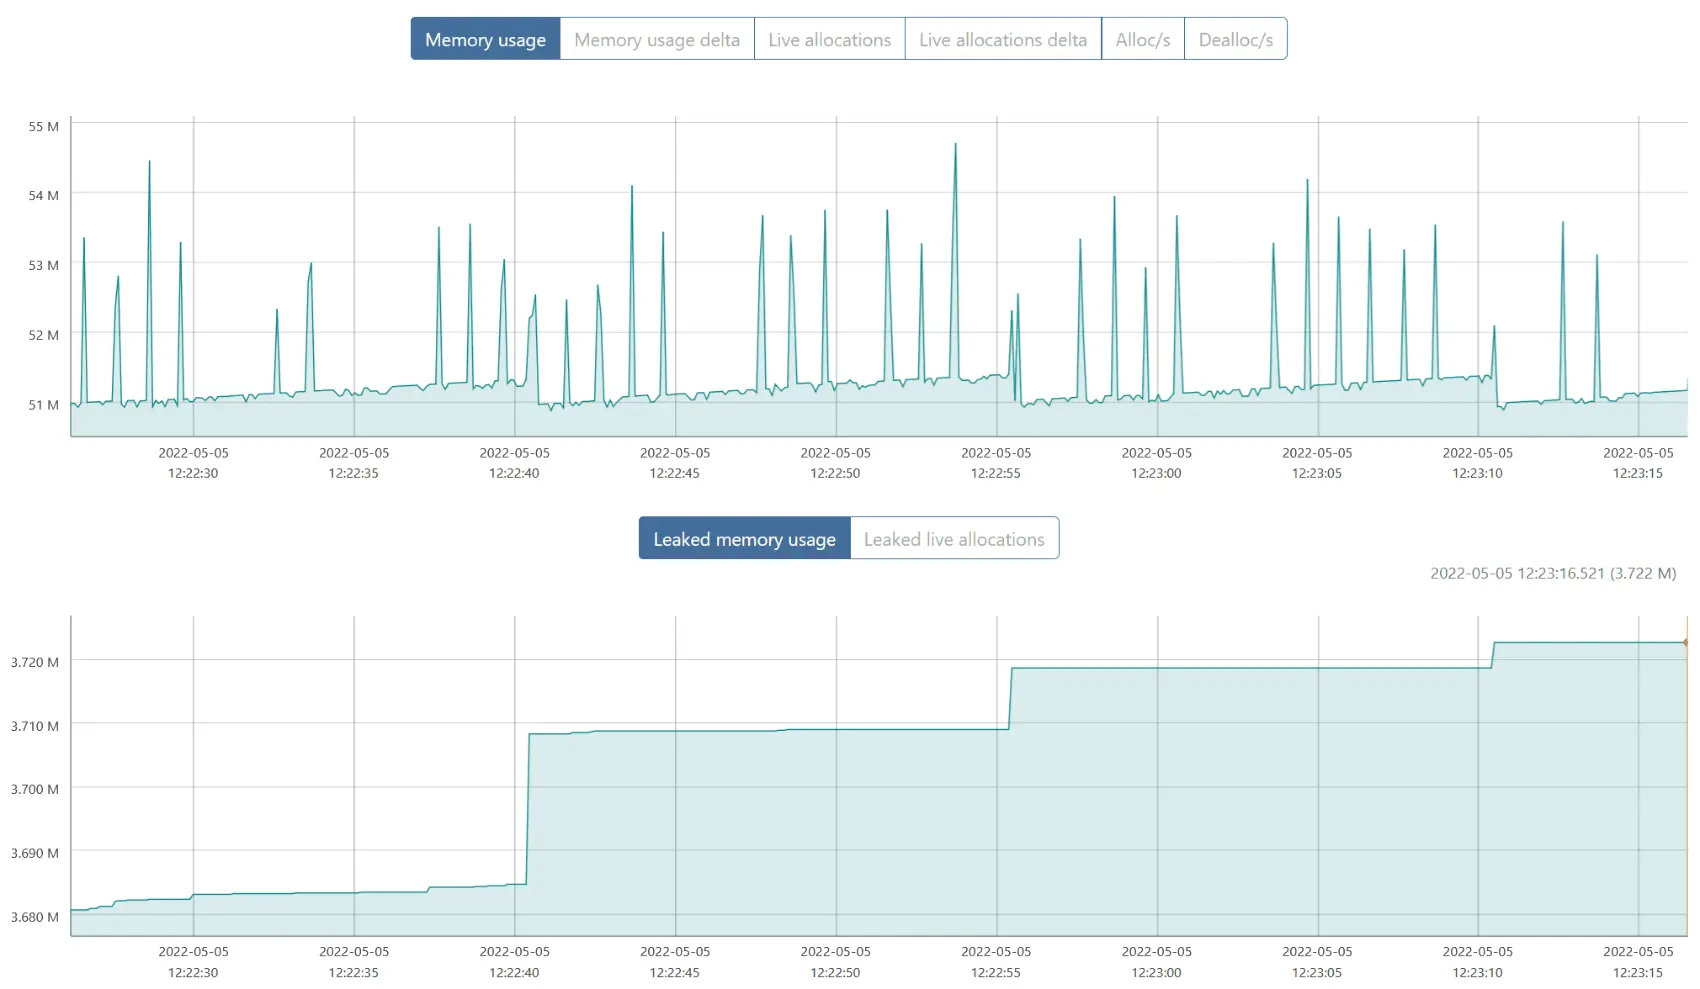
Why yes, that line does go up, still.
Showing leaked allocations, grouped by backtraces, with graphs, but this time only between two precise timestamps, we can see what’s happening. And it’s not hard to explain!
Take that one:
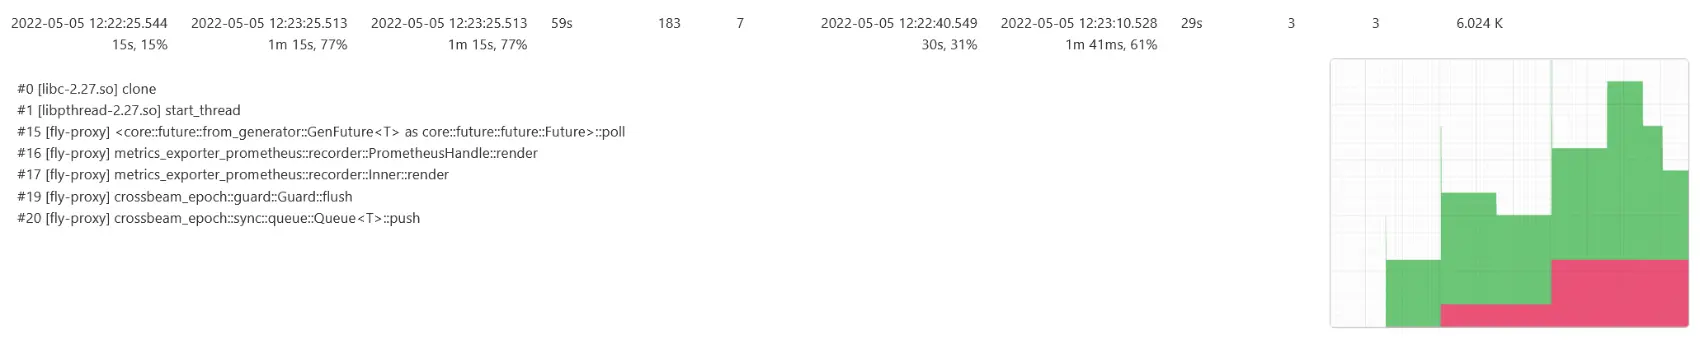
That’s a queue. Under load, backing storage is grown to accomodate more items being, well, queued. It’s never shrunk again, that would just be extra work. This is fine as long as it’s bounded in some way.
Same deal here:
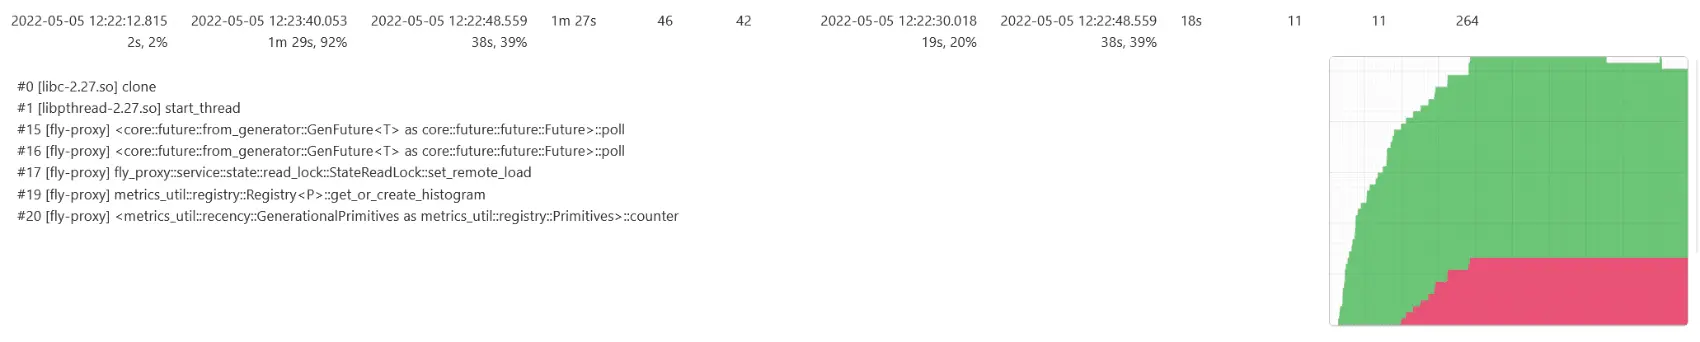
Because we keep track of latency for all requests, load generates a bunch of data points there — we need to keep some data around to compute various percentiles, until an interval was elapsed and we send them out to Prometheus.
That’s it
Of course you can leak memory, even in Rust. For even medium-sized long-running applications, lots of graphs from a good memory profiler can make life better. And they’ll probably help you find the memory leak too.