

You can send prometheus metrics to Fly.io - for free. Spin up a globally-running Laravel app in minutes!
It’s almost a hidden feature - Fly.io provides Grafana dashboards with helpful metrics for all of your Fly.io apps.
All you have to do is head to https://fly-metrics.net/.
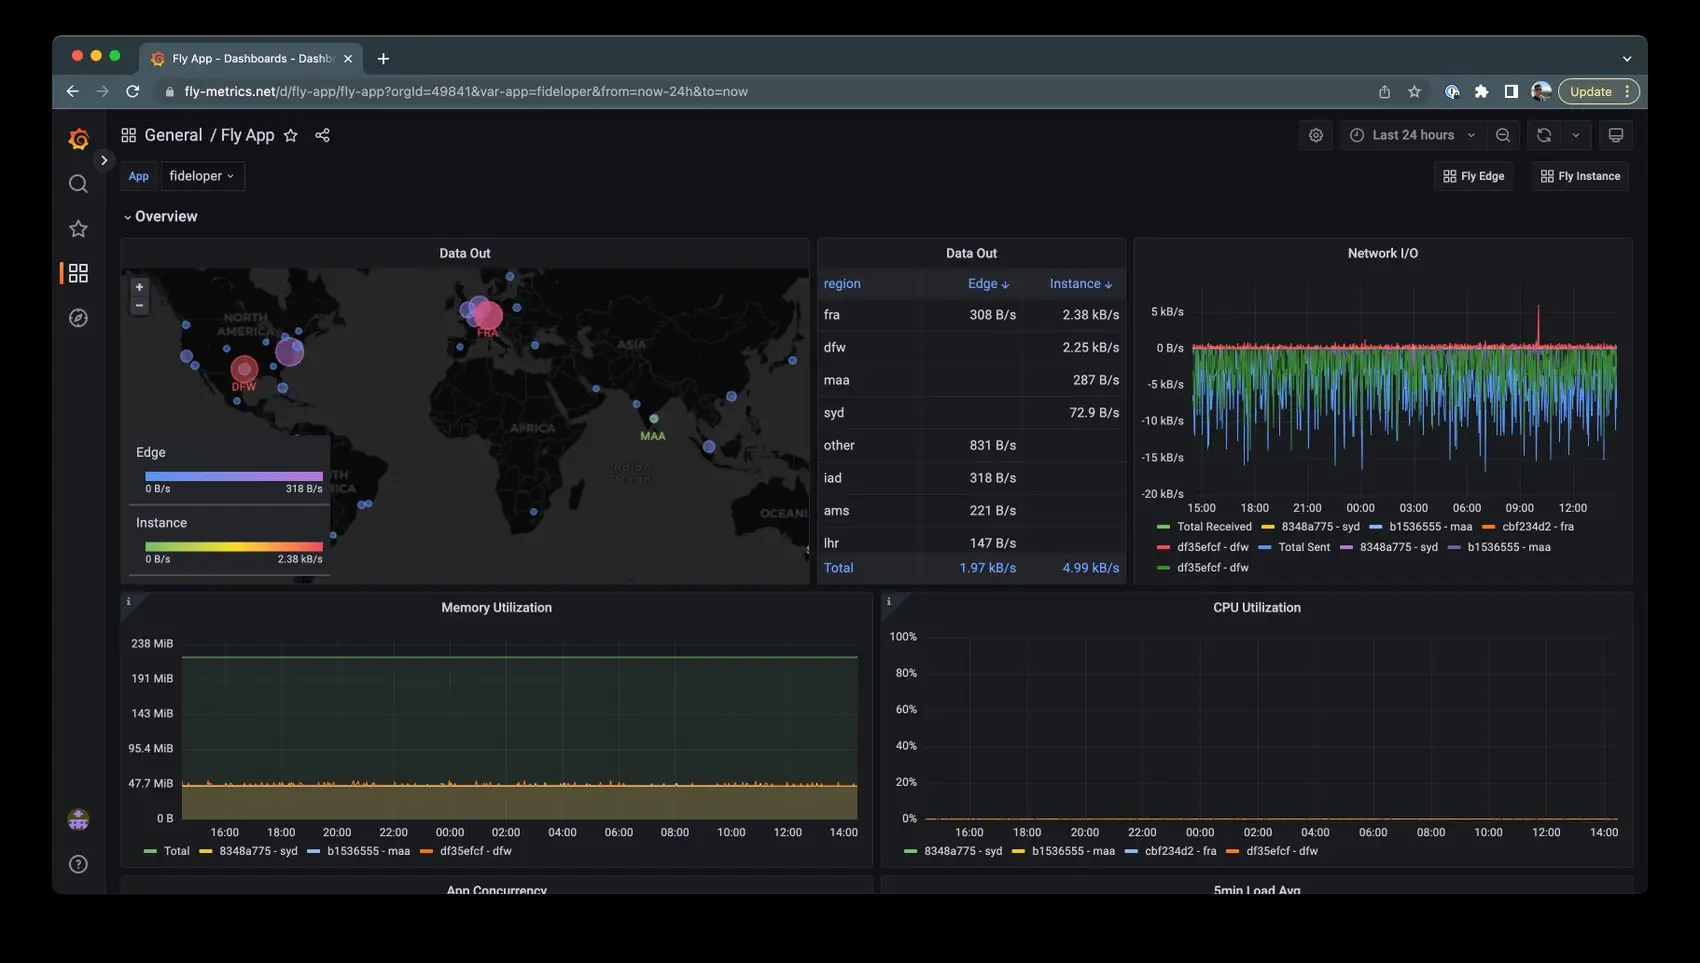
👉 Here’s the kicker: If your app publishes some metrics, Fly.io will read them. You can then view them in the provided Grafana dashboard! 🪄
The metrics just need to be Prometheus-flavored.
Instrument your App
We’re going to talk about how to “instrument” your app. Here’s a super dry definition:
The term instrumentation refers to an ability to monitor or measure the level of a product’s performance and to diagnose errors.
So, we’re going to “instrument” a Laravel application by having it generate Prometheus-friendly metrics.
Fly.io will read those and let us graph them in the hosted Grafana at fly-metrics.net.
Since Fly.io provides the infrastructure to get this done, all we need to care about is our code base.
Grafana + Prometheus
An extremely popular pairing is Prometheus (for collecting metrics) and Grafana (for graphing metrics).
Prometheus works by “pulling” metrics into it - it’s basically a web scraper, reaching out with HTTP requests to various configured locations to find metrics.
If your application creates an endpoint that spits out Prometheus-friendly metrics, than Fly.io can consume them and make them visible for use in the Grafana dashboard!
This means baking a URI endpoint, such as /metrics, into your application for Prometheus to read.
We’re going to see how to generate metrics and expose them for Prometheus. These ideas are applicable to apps in any language or framework.
Metric Types
There are a few different metric types you can create:
- Counters
- Gauges
- Histograms
- Summaries
Counters are values that only go up. They can’t go down, but they can be reset to zero.
These are useful when you want to see the rate of occurrences of something over time. Usually the actual count is less interesting than the rate they occur, or the rate of change. A common example is the count of inbound HTTP API requests made to your application.
Gauges can go up and down in value, and are perhaps the most commonly used metric. An example Gauge value is server RAM or CPU usage.
Histograms will count occurrences of events (or whatever your data is) into buckets. Percentile charts with the classic bell-curve distribution is a histogram. You might use this to be able to say “90% of HTTP responses were 2-3k in size”.
Summaries are like histograms, but it can calculate quantiles over a sliding time window. Does that sound like I know what I’m talking about? You’ll have to read about them yourself.
What to Measure
Let’s see how to instrument our Laravel applications. We’ll tell certain parts of our code to record metrics when something interesting happens.
What counts as “interesting” depends on your application.
I just did this work for Chipper CI, so I’ll use examples from that! This is an app that runs continuous integration builds for Laravel apps.
I wanted metrics on the following things:
- Number of builds over time - Fairly simple, a count of builds over time. This never goes down, and I’m interested to see trends in this number (and be able to break them down per team)
- Number of paid builds - This one is interesting as it starts at zero at the beginning of each month (the billing period), and goes up depending on the plan a team is paying for. This number goes up when customers go over their free tier (or if they go over builds they pre-paid for).
I chose a counter for the first, and a gauge for the second.
The majority of the work here is just figuring out our Prometheus metrics. The code side of things isn’t so hard!
These metrics are both business metrics and (sort of) ops metrics! That’s fine, I like measuring whatever is useful.
Metrics in Laravel
There’s a few things we need to do in order to get these metrics collected and visible to Prometheus:
- Prometheus only scrapes for metrics periodically, so we need a way to persist our metrics.
- We need to provide a
/metrics(or similar) endpoint that spits out metrics. - Our code needs to collect the metrics.
We’ll use the PromPHP Prometheus Client which is actively maintained. There are a few Laravel wrappers for this out there, but they seem unmaintained (apologies to any open source maintainer of those if I’m getting that wrong).
Since writing this article, Spatie has released package Laravel-Prometheus, which does some of this work for you!
Persisting Metrics
I persisted my metrics in Redis. The PHP package provides Redis as one of it’s storage mechanisms - we just need to tell it where our Redis instance is.
I used a Service Provider for this:
# Oh yeah, and install the library
composer require promphp/prometheus_client_php

# Then make a service provider
php artisan make:provider PrometheusServiceProvider
And in that service provider:
<?php

namespace App\Providers;

use Prometheus\Storage\Redis;
use Prometheus\CollectorRegistry;

use Illuminate\Support\Arr;
use Illuminate\Support\ServiceProvider;
use Illuminate\Contracts\Foundation\Application;

class PrometheusServiceProvider extends ServiceProvider
{
    public function register()
    {
        $this->app->singleton(CollectorRegistry::class, function() {
            Redis::setDefaultOptions(
                Arr::only(
                     config('database.redis.default'),
                     ['host', 'port', 'password']
                )
            );

            return CollectorRegistry::getDefault();
        });
    }
}
We tell Laravel to create a singleton of class CollectorRegistry (the main entrypoint of the library). Whenever we request that class, we want Laravel’s container to send back the same instance of CollectorRegistry that we create above
We take the opportunity to set its Redis storage to use our default connection information.
Be sure to register the service provider in your config/app.php file!
Note: If you use Upstash Redis on Fly.io, you’ll get a connection URL for Redis. It will look like redis://default:<some-password>@<some-hostname>. You can break this into pieces for Laravel’s REDIS_HOST and REDIS_PASSWORD fields (ignore the “default” username).
A Facade
This singleton we registered with Laravel’s container is handy if we type hint the CollectorRegistry, allowing Laravel to automagically create the class for us.
I also like to create a Facade for this use case, as Facades give you easy ways to swap out to a fake when running tests. This is great if your tests run a code path that triggers a metric creation.
To do that, I create a file app/Prometheus/Prom.php with the following:
<?php

namespace App\Prometheus;


use Prometheus\CollectorRegistry;
use Illuminate\Support\Facades\Facade;

class Prom extends Facade
{
    public static function fake()
    {
        static::swap(new Fake);
    }

    protected static function getFacadeAccessor()
    {
        return CollectorRegistry::class;
    }
}
Now we can call Prom::whatever() and have that pass off the method call to the CollectorRegistry. In tests, we can call Prom::fake() so that a fake CollectorRegistry is called that doesn’t do anything.
The Fake class has __call and __callStatic magic methods that do nothing.
Metrics Endpoint
Let’s next see how to create a /metrics endpoint. This part is pretty easy - there’s a convenient few function calls we make to have the library generate the output for the metrics.
If we register route to an invokable controller via Route::get('/metrics', MetricsController::class), the controller just needs something like the following:
<?php

# generated via
# php artisan make:controller -i MetricsController
namespace App\Http\Controllers;

use App\Prometheus\Prom;
use Illuminate\Http\Request;
use Prometheus\RenderTextFormat;

class MetricsController extends Controller
{
    public function __invoke(Request $request)
    {
        $formatter = new RenderTextFormat;

        return response(
            $formatter->render(Prom::getMetricFamilySamples()),
            200,
            [
                'Content-Type' => RenderTextFormat::MIME_TYPE,
            ]
        );
    }
}
You may want to add a middleware to this so the route is not accessible to the entire world.
Collecting Metrics
Collecting metrics is fairly easy - we can generate a counter (or gauge, or whatever), and then call a method on it such as inc() or set() to set a value.
The interesting part is labels! You can define what labels exist when generating the metric (counter, gauge, etc). Then you must set those labels values when adding the metric.
That looks like this:
// We get/create a counter: $namespace, $metric_name, $description, $labels
$counter = Prom::getOrRegisterCounter('chipper', 'build_count', 'Number of CI builds', ['team', 'platform']);

// Increment counter "build_count" by 1, setting values for labels "team" and "platform"
$counter->inc([$team->getKey(), 'fly']);
We can create (or get) a counter metric. This requires a few parameters, including setting the label..uh..labels - the “keys” (rather than the values). I set “team”, which is a numerical team ID, and “platform” because Chipper CI has 2 build platforms (an old one based on a Nomad cluster, and a newer one based on Fly Machines).
Each time we increment this counter, we need to set those label values. We see that in the 2nd line there, where we pass the Team’s ID, and the platform used.
The gauge metric is very similar:
// We get/create a gauge: $namespace, $metric_name, $description, $label(s)
$gauge = Prom::getOrRegisterGauge('chipper', 'billable_builds', 'Number of CI billable builds', ['team']);

// Increment guague "billable_builds" by 1, setting value for label "team"
$gauge->set(42, [$team->getKey()]);
Just like counters, gauges can inc() or incBy(). They also have a method set() to set an exact value.
Once you know what you want to measure in your application, you can call those methods as needed.
Fly.io ❤️ Laravel
Try out Fly, get free metrics. Deploy globally on Fly in minutes!
Deploy your Laravel app! →
Fly Configuration
Once your application has metrics to collect, we need to view those. Rather than setup Prometheus and Grafana yourself, Fly.io will do this for you.
You can add something like the following to your fly.toml:
[metrics]
  port = 8080
  path = "/metrics"
Fly.io will then scrape that endpoint. Be sure to get the port right - by default, Laravel apps run on port 8080 inside the VM (port 80 and 443 are exposed to the outside world, but Fly.io uses the internal private network).
If your application does stuff like redirect all requests from “http” to “https://”, you may run into issues.
Within a few minutes after a successful deployment, you should be able to spot the /metrics endpoint getting hit occasionally in your access logs.
Grafana
When that’s setup, and metrics are getting collected, you can start to make some graphs within https://fly-metrics.net!
You can create a new dashboard, and add a graph (click the “add a new panel” button) to the dashboard.
When creating a graph, what I do is two-fold:
- Create a variable (it’s a Dashboard setting)
- Create a graph that can use that variable
The Variable
Here I created a variable named “team”, which will let me filter by the team label.
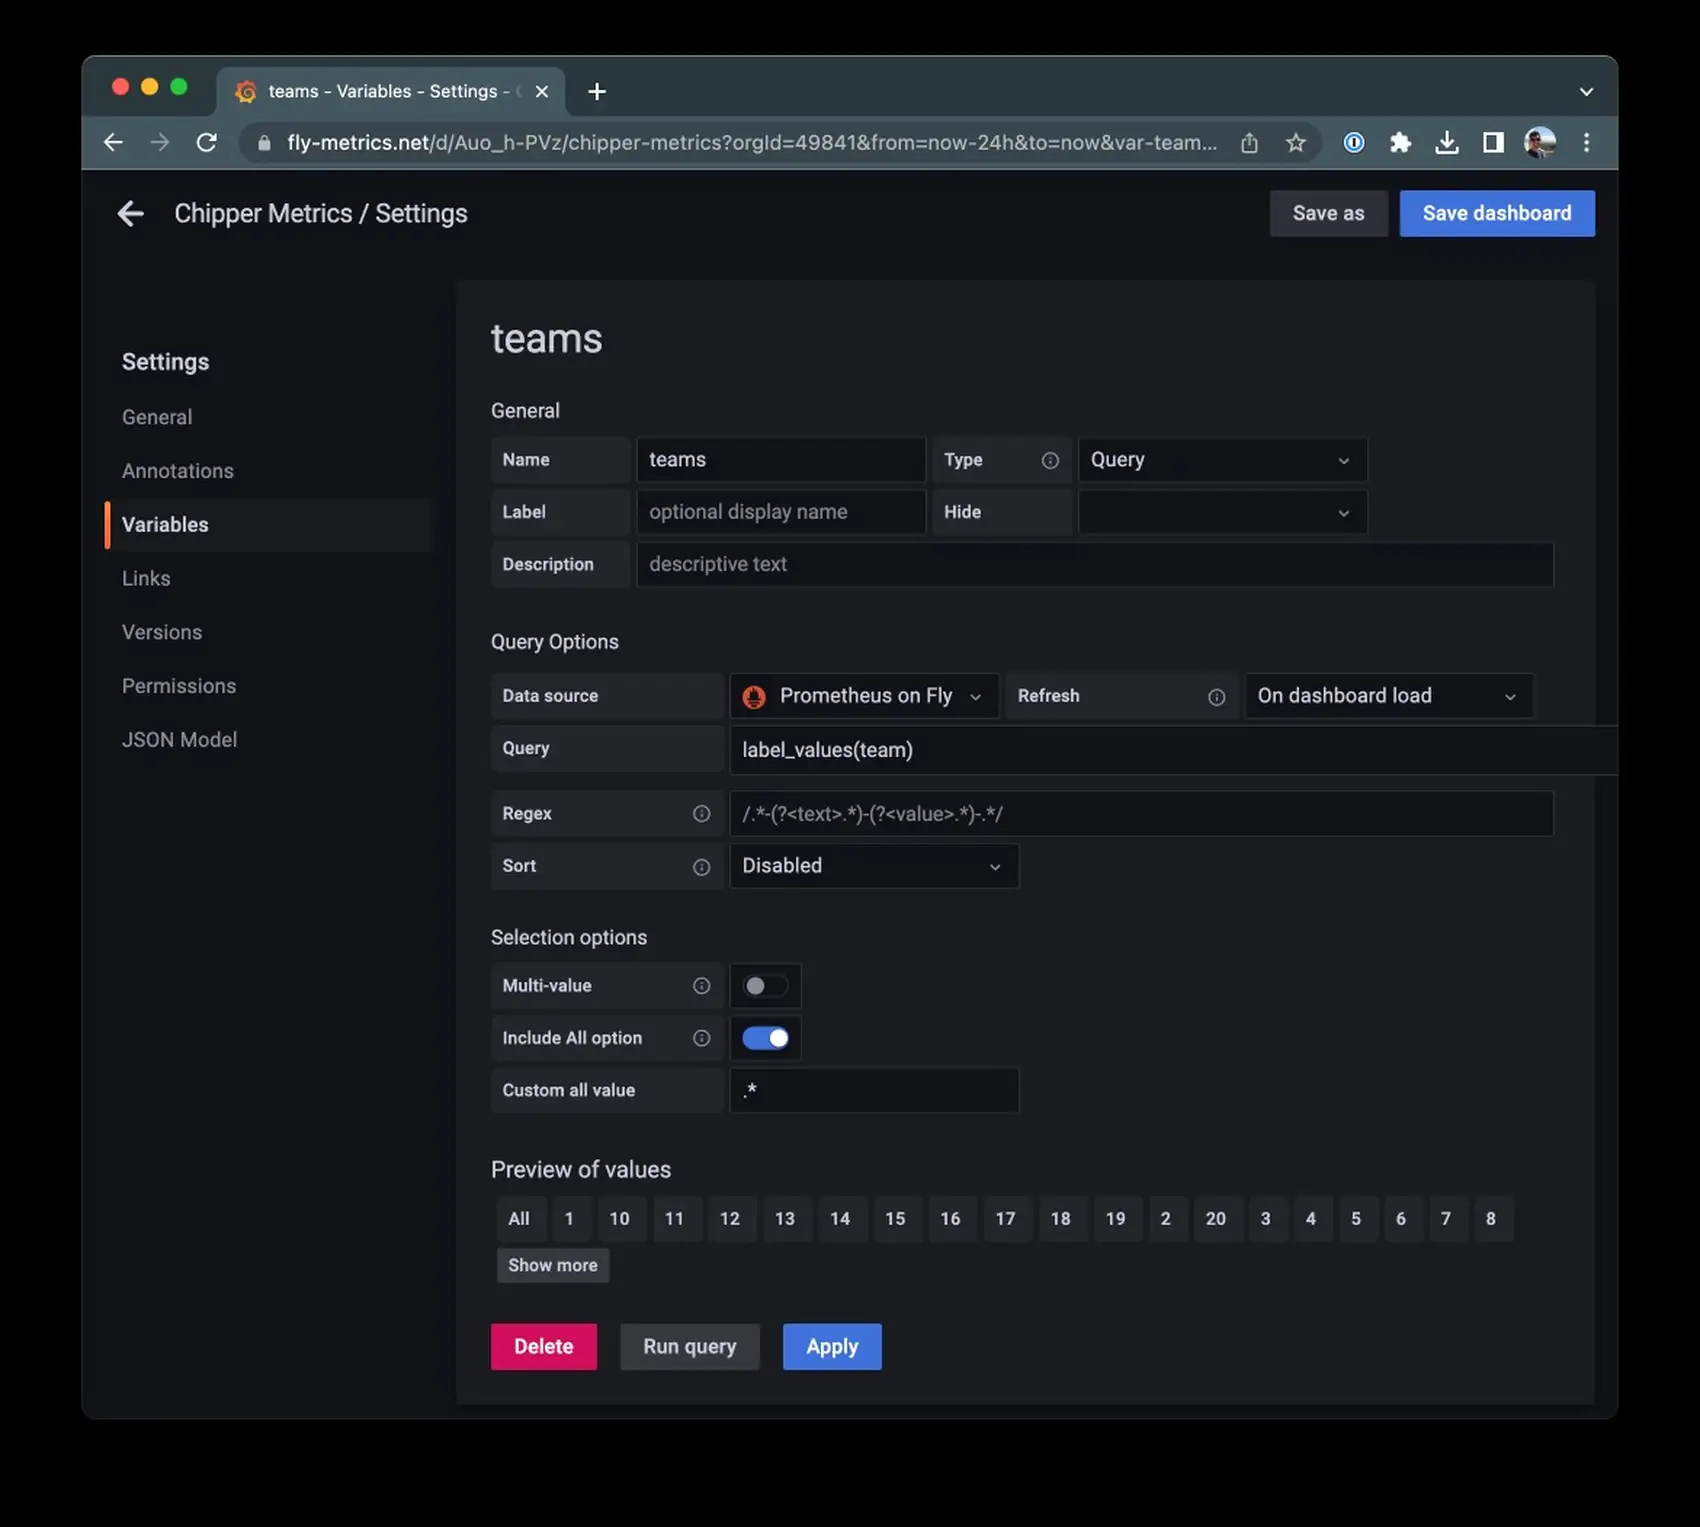
The important parts here: We get all unique values for label team via label_values(team). Then we include an all option which is a regex wildcard card .*.
A Graph
Then I can create a graph that makes use of that variable:
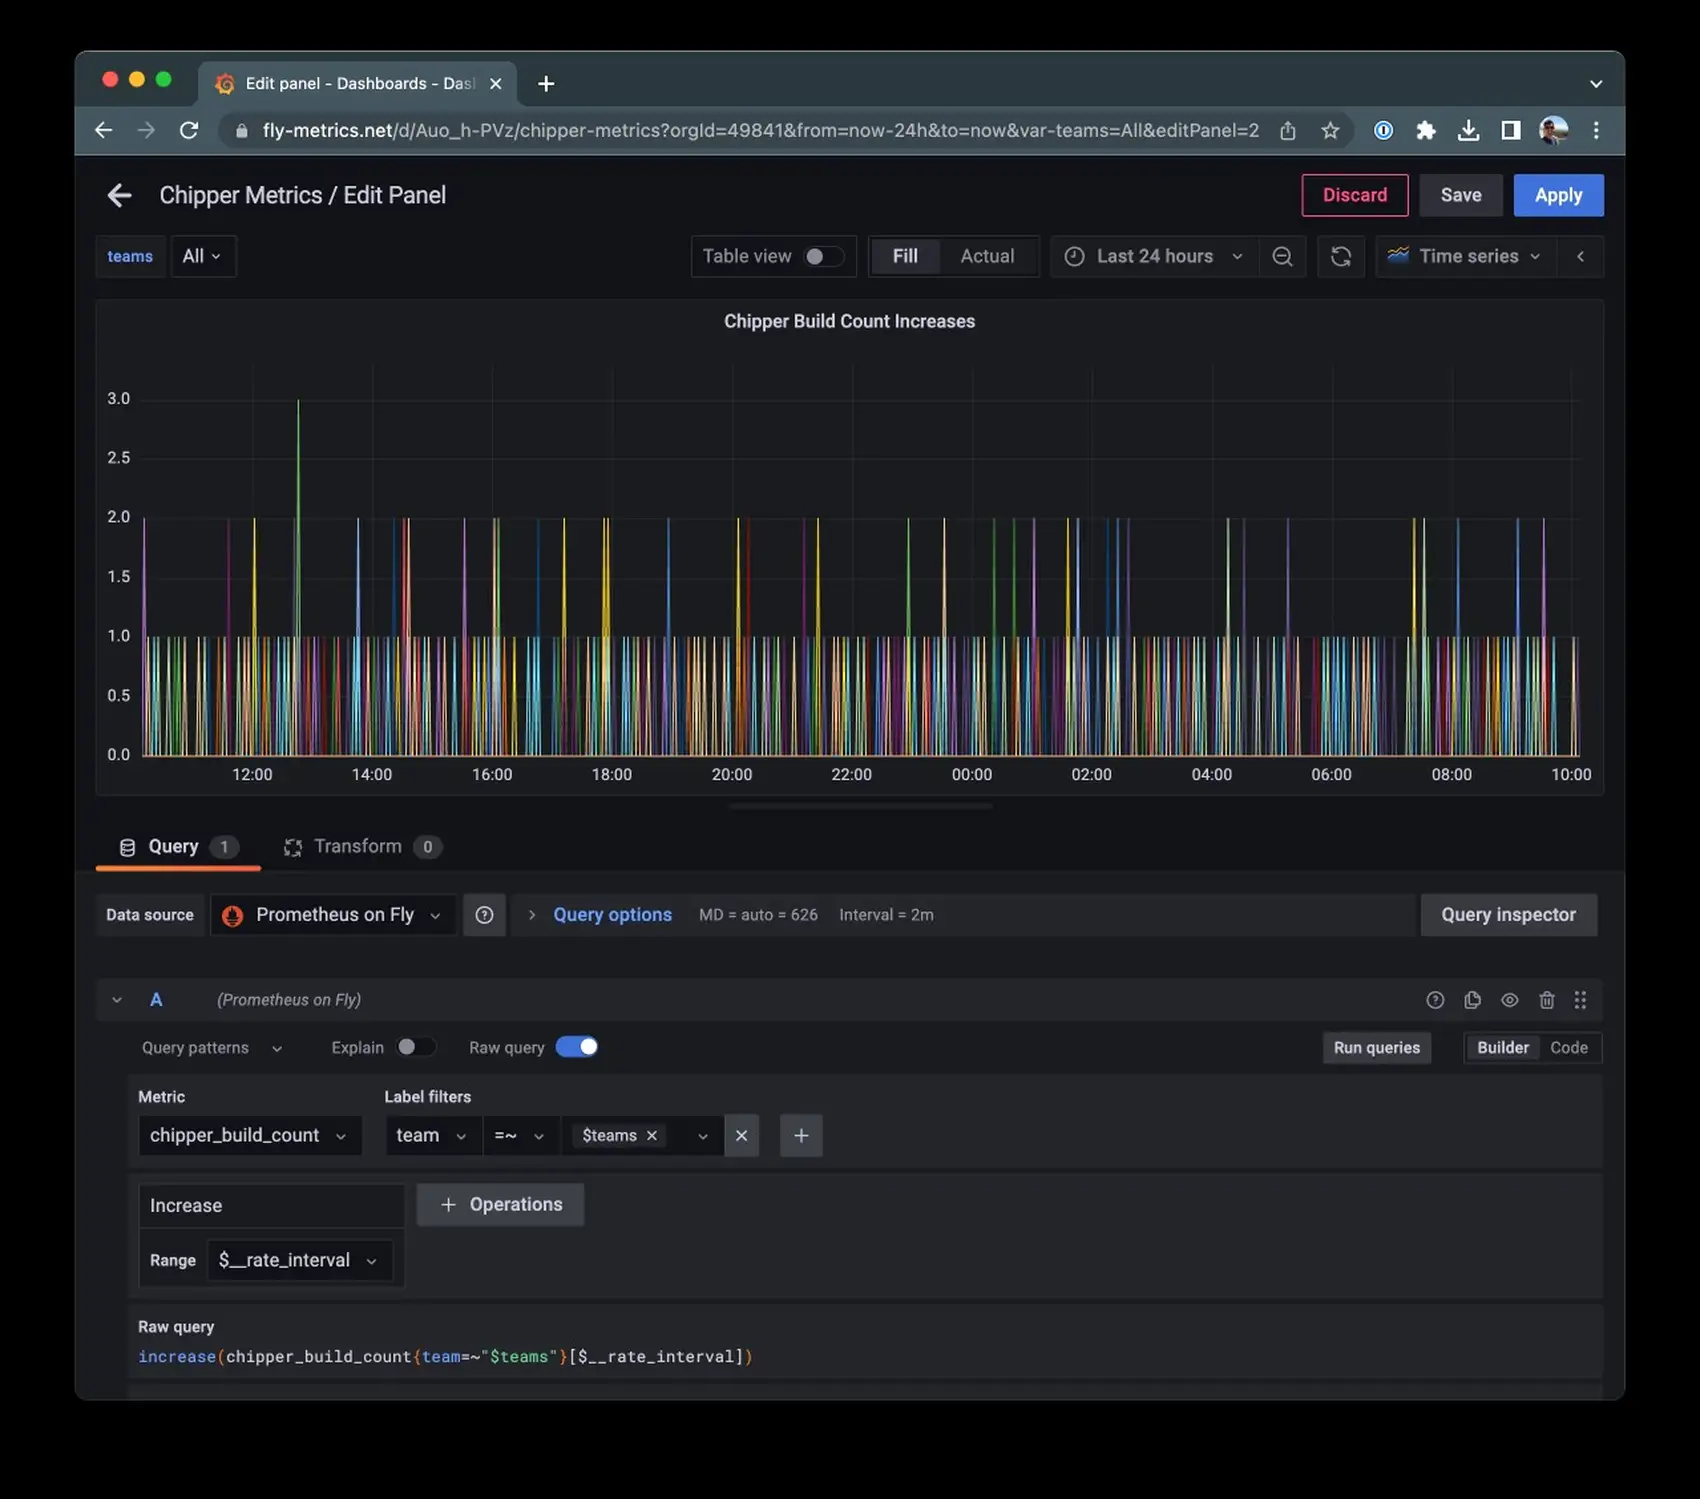
Setting the data source as Prometheus on Fly will auto-populate the Metric dropdown. You can select a custom metric, and then start playing with aggregation functions and so on. Here we graph the rate of increase, which will help spot potential issues of large spikes in build counts.
Note that we use =~, which sets the team label as a regex. That allows the “all” option of .* to work so any/all teams are included when all is used as
a dashboard filter. The variable also lets you filter by specific label!