

Here’s a fun bug.
The basic idea of our service is that we run containers for our users, as hardware-isolated virtual machines (Fly Machines), on hardware we own around the world. What makes that interesting is that we also connect every Fly Machine to a global Anycast network. If your app is running in Hong Kong and Dallas, and a request for it arrives in Singapore, we’ll route it to HKG.
Our own hardware fleet is roughly divided into two kinds of servers: edges, which receive incoming requests from the Internet, and workers, which run Fly Machines. Edges exist almost solely to run a Rust program called fly-proxy, the router at the heart of our Anycast network.
So: a week or so ago, we flag an incident. Lots of things generate incidents: synthetic monitoring failures, metric thresholds, health check failures. In this case two edge tripwires tripped: elevated fly-proxy HTTP errors, and skyrocketing CPU utilization, on a couple hosts in IAD.
Our incident process is pretty ironed out at this point. We created an incident channel (we ❤️ Rootly for this, seriously check out Rootly, an infra MVP here for years now), and incident responders quickly concluded that, while something hinky was definitely going on, the platform was fine. We have a lot of edges, and we’ve also recently converted many of our edge servers to significantly beefier hardware.
Bouncing fly-proxy clears the problem up on an affected proxy. But this wouldn’t be much of an interesting story if the problem didn’t later come back. So, for some number of hours, we’re in an annoying steady-state of getting paged and bouncing proxies.
While this is happening, Pavel, on our proxy team, pulls a profile from an angry proxy.
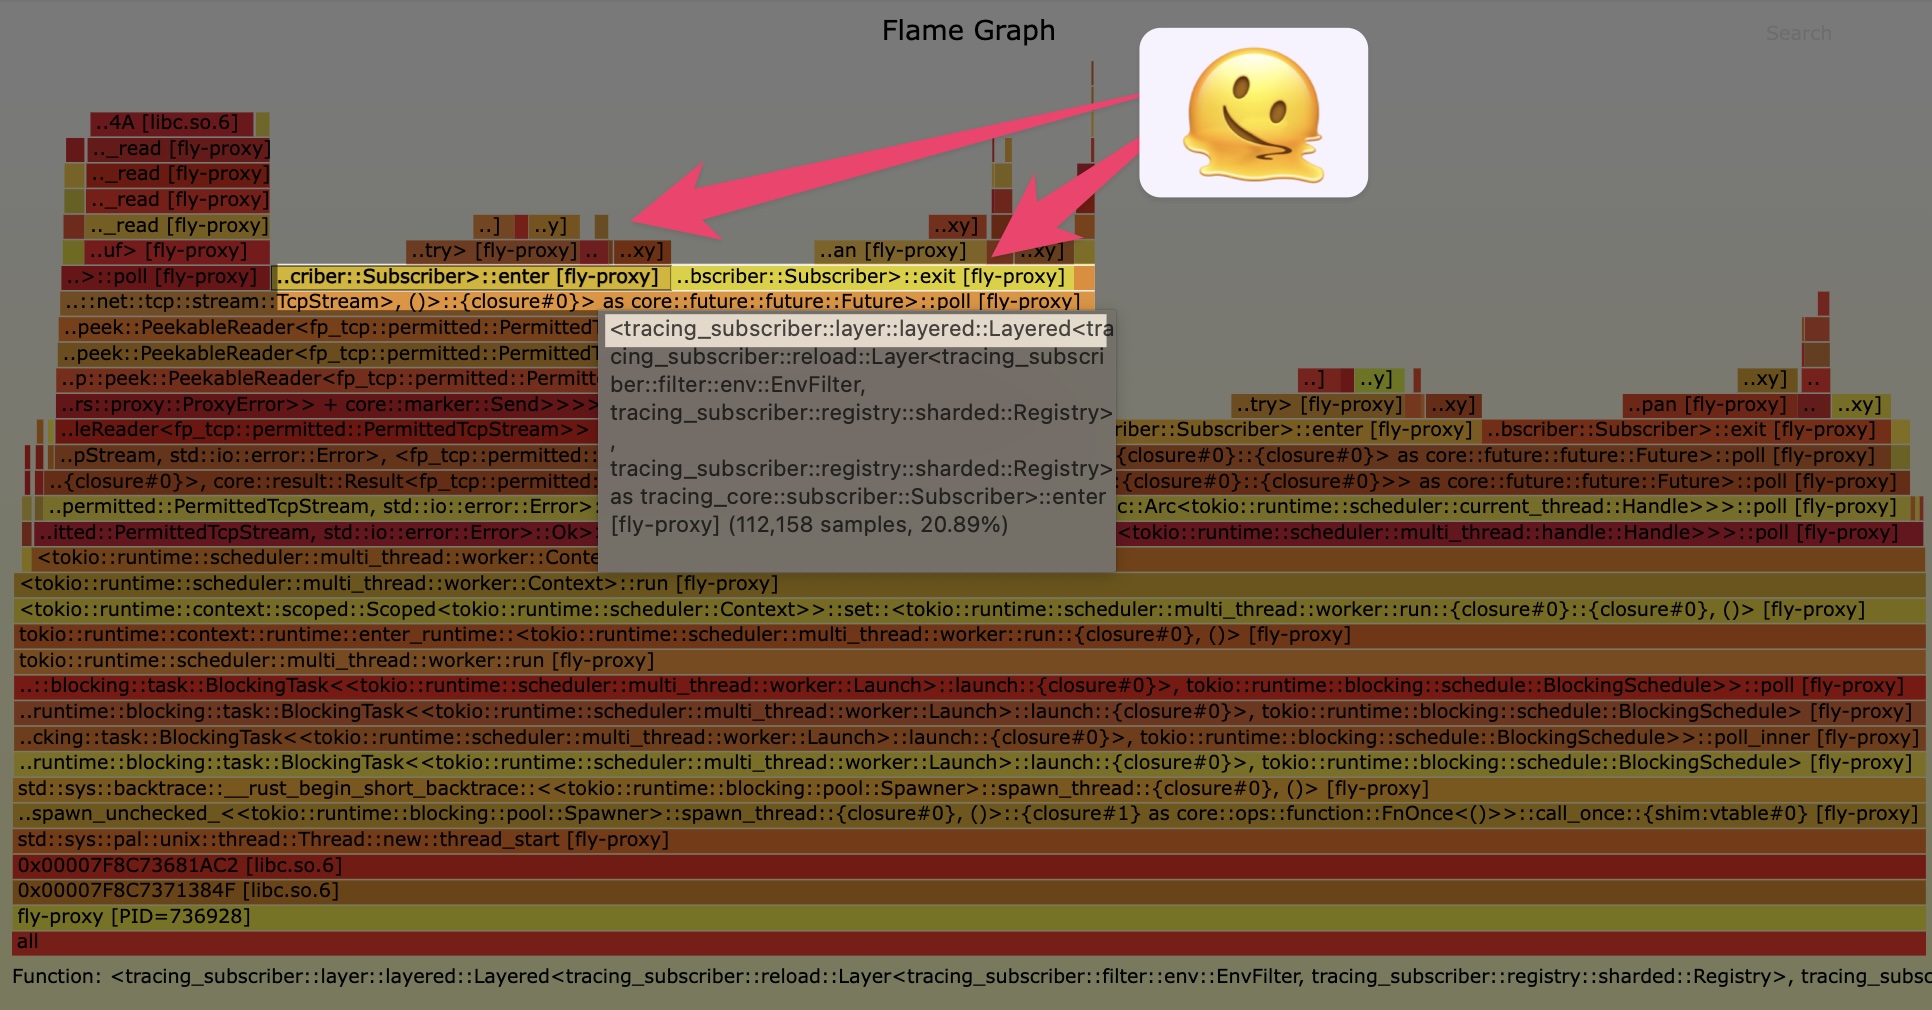 So, this is fuckin’ weird: a huge chunk of the profile is dominated by Rust
 tracing‘s Subscriber. But that doesn’t make sense. The entire point of Rust tracing, which generates fine-grained span records for program activity, is that entering and exiting a span is very, very fast.
If the mere act of entering a span in a Tokio stack is chewing up a significant amount of CPU, something has gone haywire: the actual code being traced must be doing next to nothing.
A Quick Refresher On Async Rust
So in Rust, like a lot of async/await languages, you’ve got Futures. A Future is a type that represents the future value of an asychronous computation, like reading from a socket. Futures are state machines, and they’re lazy: they expose one basic operation, poll, which an executor (like Tokio) calls to advance the state machine. That poll returns whether the Future is still Pending, or Ready with a result.
In theory, you could build an executor that drove a bunch of Futures just by storing them in a list and busypolling each of them, round robin, until they return Ready. This executor would defeat the much of the purpose of asynchronous program, so no real executor works that way.
Instead, a runtime like Tokio integrates Futures with an event loop (on epoll or kqeue) and, when calling poll, passes a Waker. The Waker is an abstract handle that allows the Future to instruct the Tokio runtime to call poll, because something has happened.
To complicate things: an ordinary Future is a one-shot value. Once it’s Ready, it can’t be polled anymore. But with network programming, that’s usually not what you want: data usually arrives in streams, which you want to track and make progress on as you can. So async Rust provides AsyncRead and AsyncWrite traits, which build on Futures, and provide methods like poll_read that return Ready every time there’s data ready.
So far so good? OK. Now, there are two footguns in this design.
The first footgun is that a poll of a Future that isn’t Ready wastes cycles, and, if you have a bug in your code and that Pending poll happens to trip a Waker, you’ll slip into an infinite loop. That’s easy to see.
The second and more insidious footgun is that an AsyncRead can poll_read to a Ready that doesn’t actually progress its underlying state machine. Since the idea of AsyncRead is that you keep poll_reading until it stops being Ready, this too is an infinite loop.
When we look at our profiles, what we see are samples that almost terminate in libc, but spend next to no time in the kernel doing actual I/O. The obvious explanation: we’ve entered lots of poll functions, but they’re doing almost nothing and returning immediately.
J'accuse!
Wakeup issues are annoying to debug. But the flamegraph gives us the fully qualified type of the Future we’re polling:
&mut fp_io::copy::Duplex<&mut fp_io::reusable_reader::ReusableReader<fp_tcp::peek::PeekableReader<tokio_rustls::server::TlsStream<fp_tcp_metered::MeteredIo<fp_tcp::peek::PeekableReader<fp_tcp::permitted::PermittedTcpStream>>>>>, connect::conn::Conn<tokio::net::tcp::stream::TcpStream>
This loops like a lot, but much of it is just wrapper types we wrote ourselves, and those wrappers don’t do anything interesting. What’s left to audit:
Duplex, the outermost type, one of ours, andTlsStream, from Rustls.
Duplex is a beast. It’s the core I/O state machine for proxying between connections. It’s not easy to reason about in specificity. But: it also doesn’t do anything directly with a Waker; it’s built around AsyncRead and AsyncWrite. It hasn’t changed recently and we can’t trigger misbehavior in it.
That leaves TlsStream. TlsStream is an ultra-important, load-bearing function in the Rust ecosystem. Everybody uses it. Could it harbor an async Rust footgun? Turns out, it did!
Unlike our Duplex, Rustls actually does have to get intimate with the underlying async executor. And, looking through the repository, Pavel uncovers this issue: sometimes, TlsStreams in Rustls just spin out. And it turns out, what’s causing this is a TLS state machine bug: when a TLS session is orderly-closed, with a CloseNotify Alert record, the sender of that record has informed its counterparty that no further data will be sent. But if there’s still buffered data on the underlying connection, TlsStream mishandles its Waker, and we fall into a busy-loop.
What Actually Happened To Us
Our partners in object storage, Tigris Data, were conducting some kind of load testing exercise. Some aspect of their testing system triggered the TlsStream state machine bug, which locked up one or more TlsStreams in the edge proxy handling whatever corner-casey stream they were sending.
Tigris wasn’t generating a whole lot of traffic; tens of thousands of connections, tops. But all of them sent small HTTP bodies and then terminated early. We figured some of those connections errored out, and set up the “TLS CloseNotify happened before EOF” scenario.
To be truer to the chronology, we knew pretty early on in our investigation that something Tigris was doing with their load testing was probably triggering the bug, and we got them to stop. After we worked it out, and Pavel deployed the fix, we told them to resume testing. No spin-outs.
Lessons Learned
Keep your dependencies updated. Unless you shouldn’t keep your dependencies updated. I mean, if there’s a vulnerability (and, technically, this was a DoS vulnerability), always update. And if there’s an important bugfix, update. But if there isn’t an important bugfix, updating for the hell of it might also destabilize your project? So update maybe? Most of the time?
Really, the truth of this is that keeping track of what needs to be updated is valuable work. The updates themselves are pretty fast and simple, but the process and testing infrastructure to confidently metabolize dependency updates is not.
Our other lesson here is that there’s an opportunity to spot these kinds of bugs more directly with our instrumentation. Spurious wakeups should be easy to spot, and triggering a metric when they happen should be cheap, because they’re not supposed to happen often. So that’s something we’ll go do now.