
Fly.io is a platform that makes deploying and running your Elixir applications fun again. You can do advanced monitoring with Prometheus on Fly.io without installing anything! Deploy your Elixir application and try it out!
Fly.io takes Docker containers and converts them into fleets of Firecracker micro-vms running in racks around the world. If you have a working Docker container, you can run it close to your users, whether they’re in Singapore or Amsterdam, with just a couple of commands. Fly.io is particularly nice for Elixir applications, because Elixir’s first-class support for distributed computing meshes perfectly with Fly.io’s first-class support for clusters of applications.
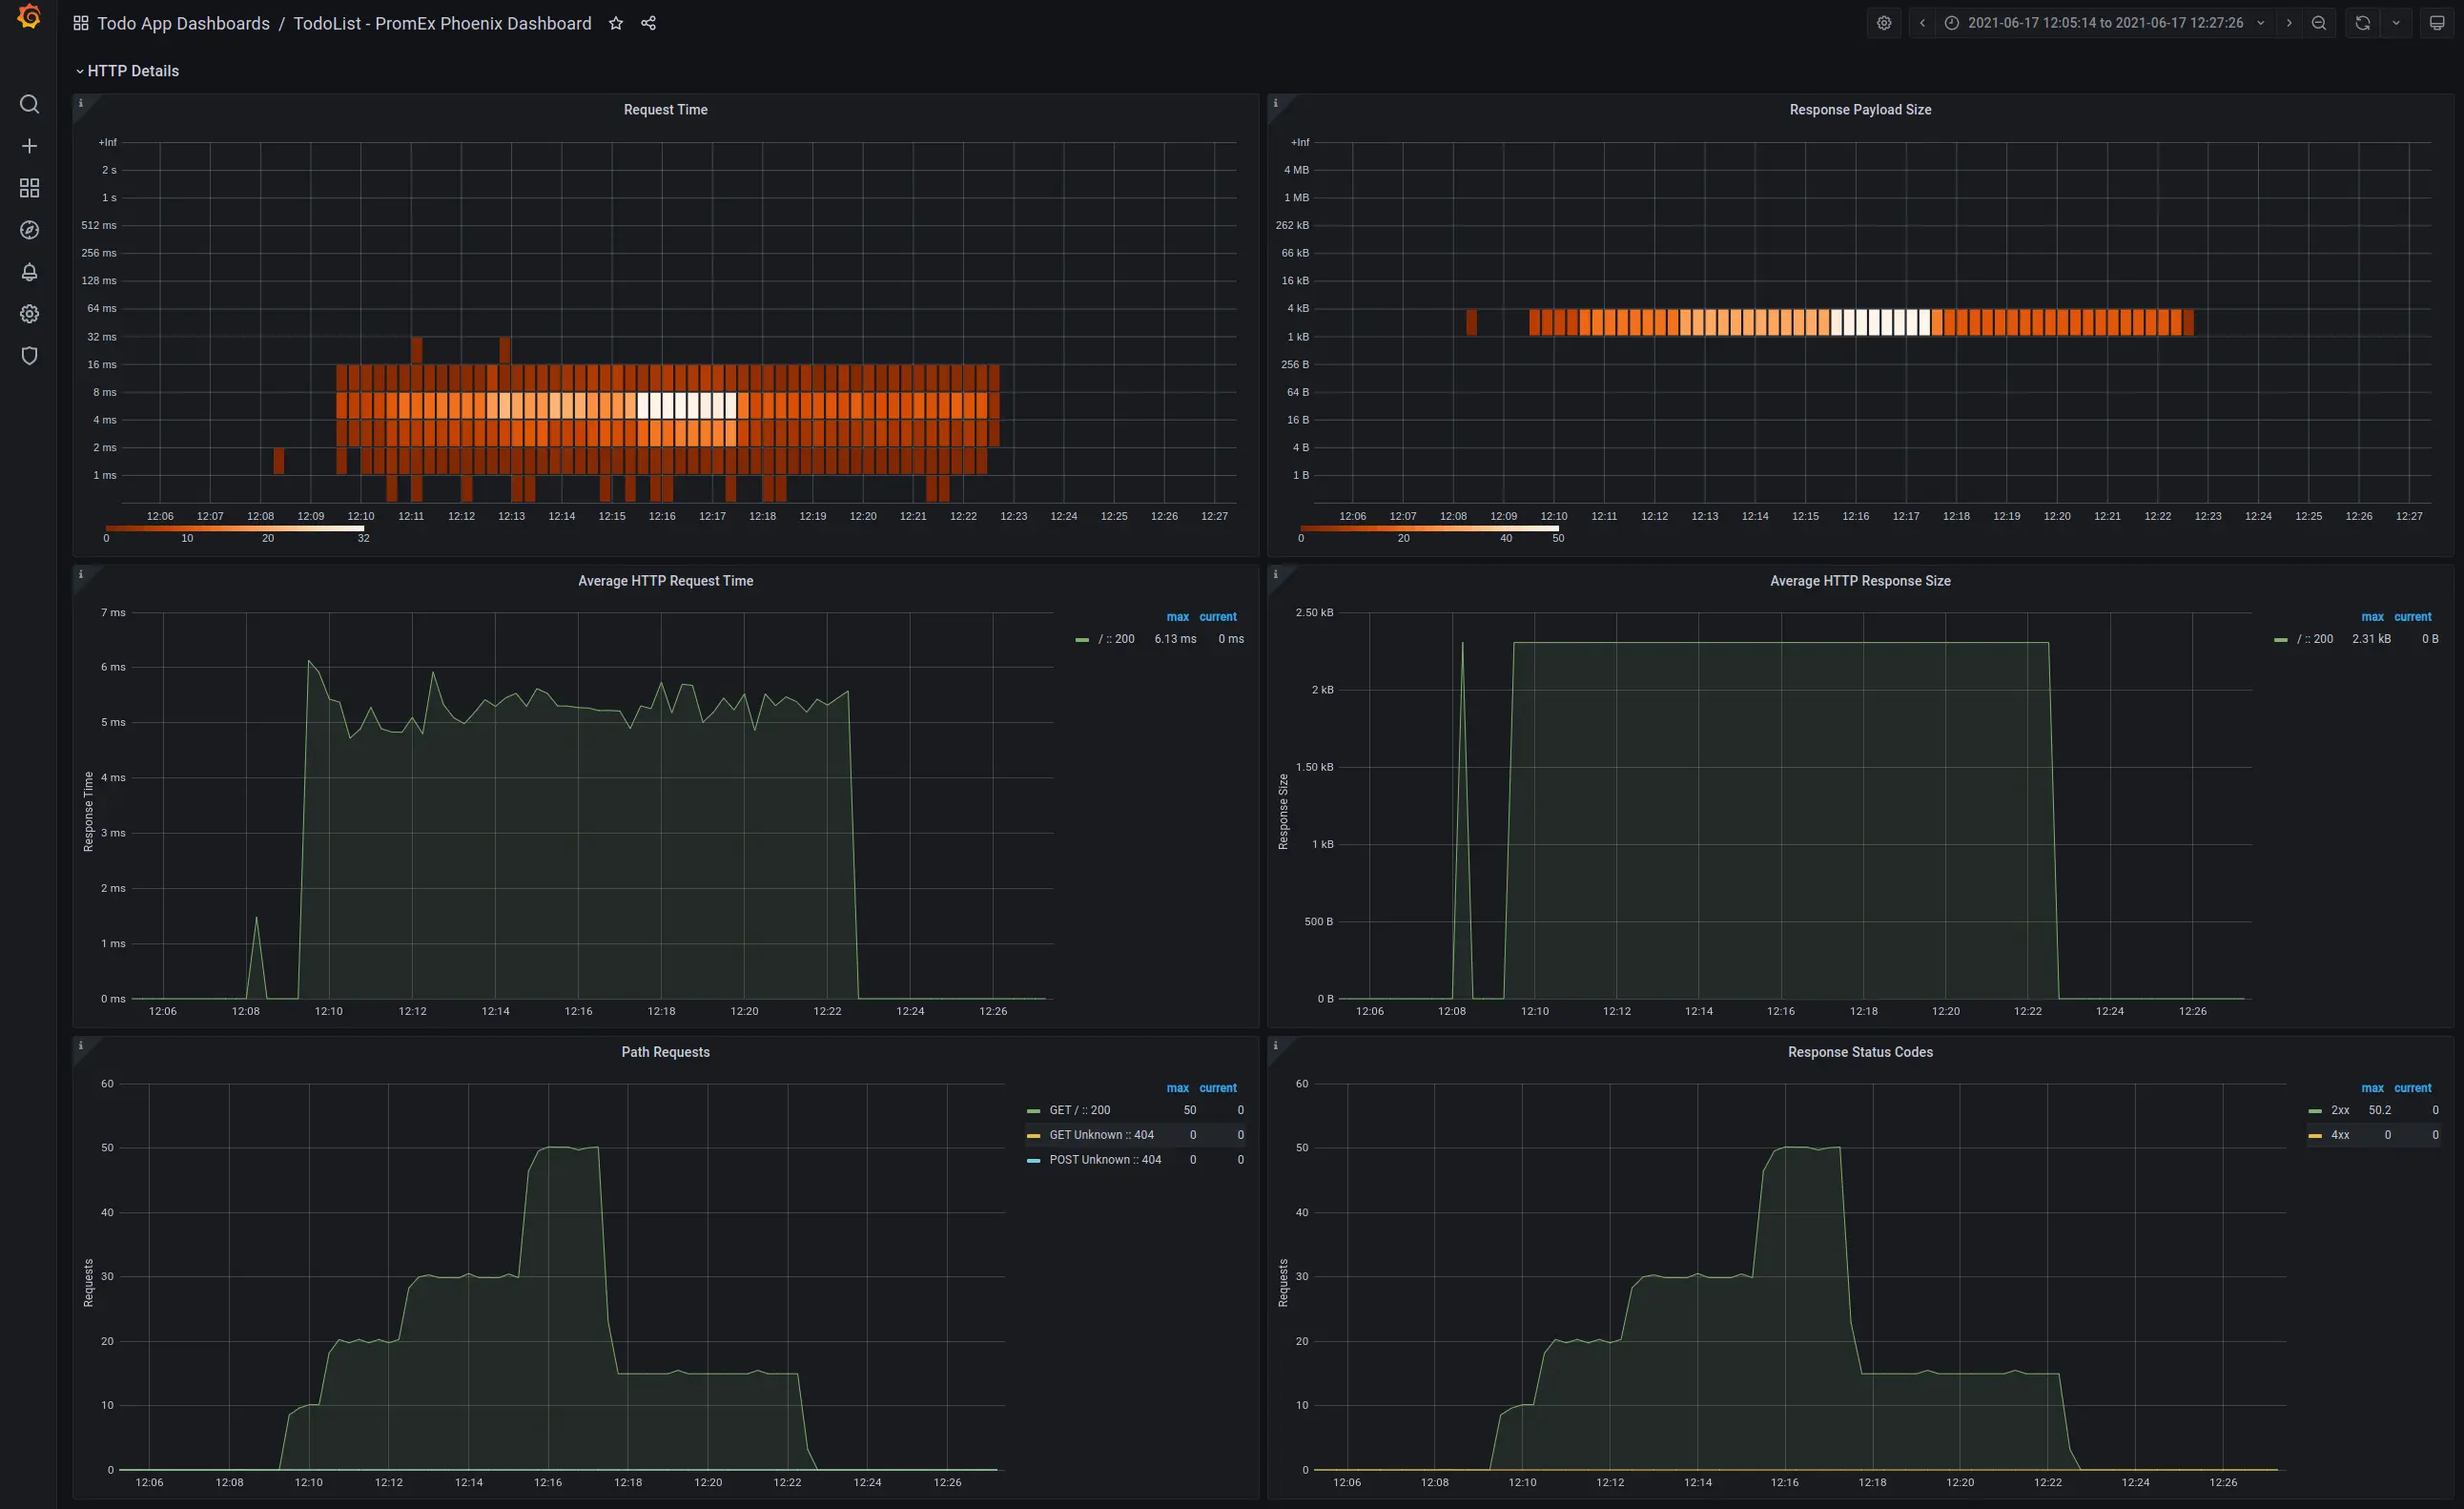
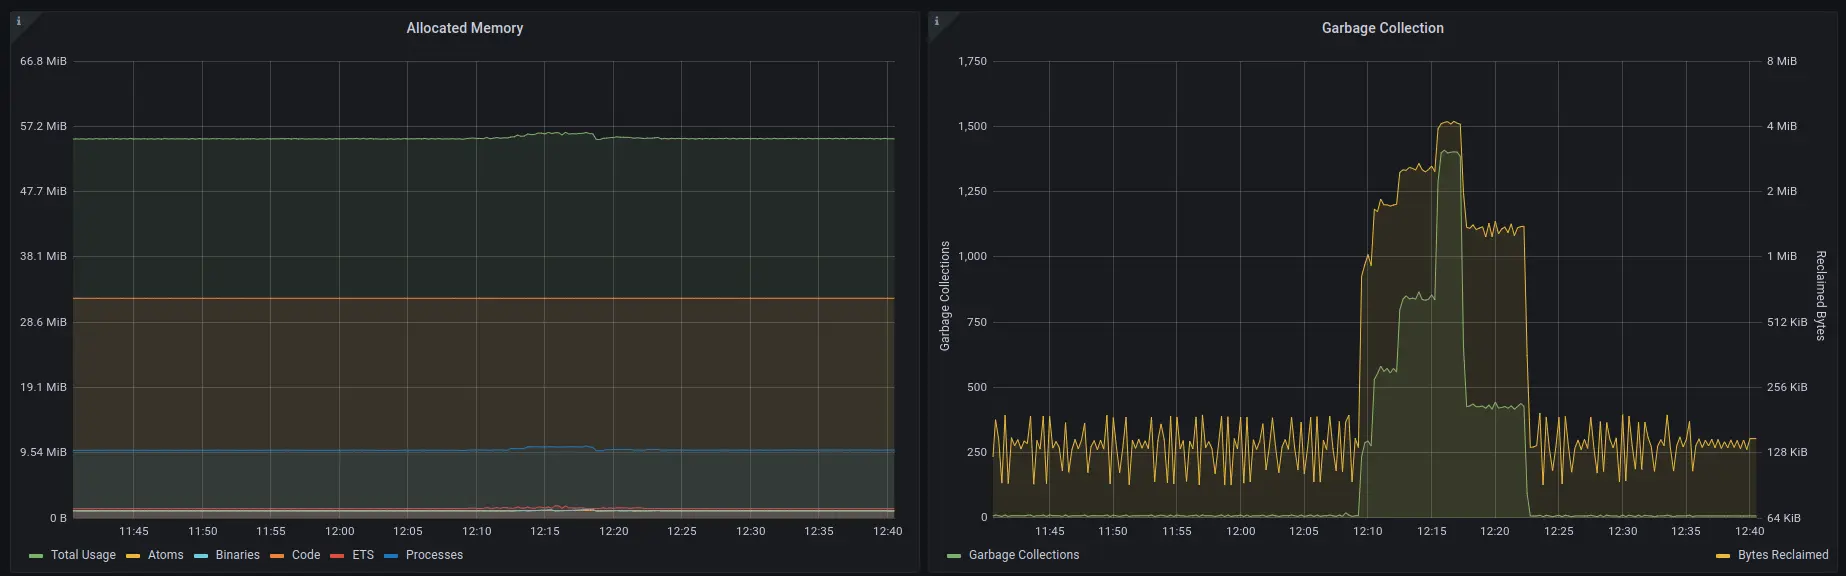
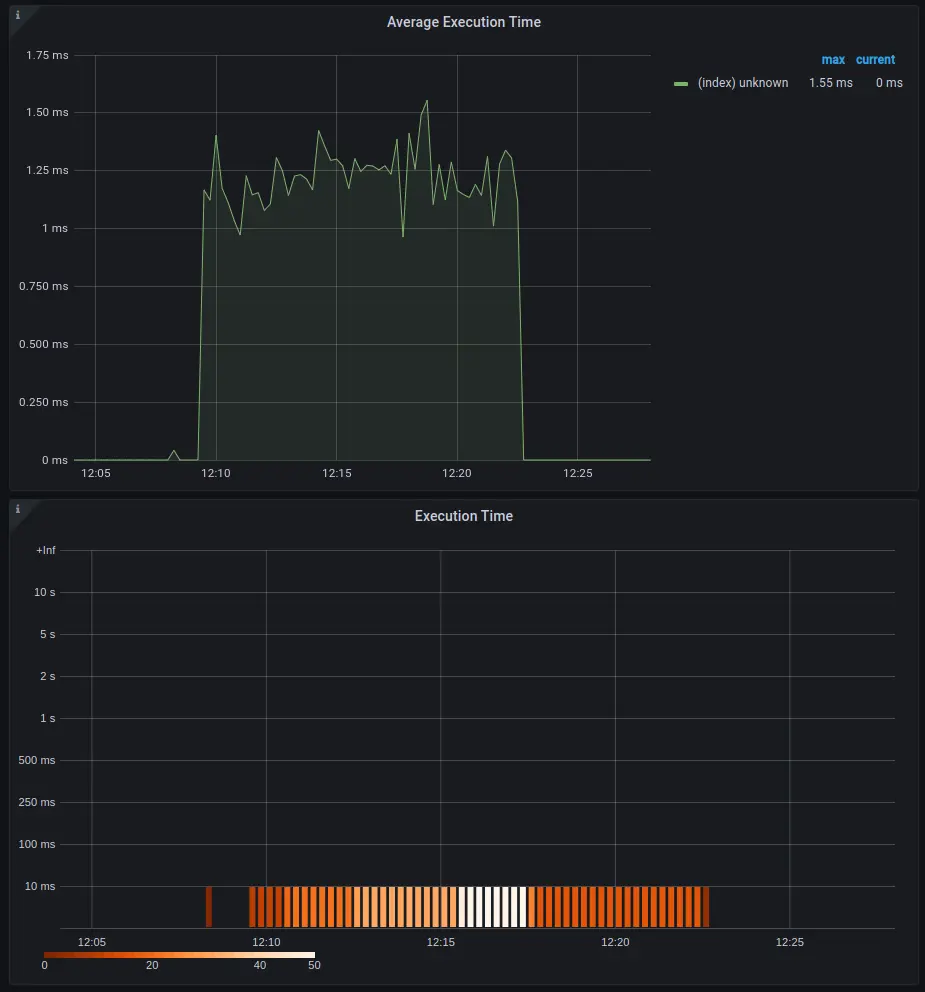
This post is about another cool Fly.io feature — built-in Prometheus metrics — and how easy it is to take advantage of them in an Elixir application. I wrote and maintain an Elixir library, PromEx, that makes it a snap to export all sorts of metrics from your Elixir applications and get them on dashboards in Grafana. Let’s explore some of the concepts surrounding Prometheus and see how we can leverage the Fly.io monitoring tools in an Elixir application to get slick looking dashboards like this one:
Why Application Monitoring is Important
When customers are paying for your application or service, they expect it to work every time they reach for it. When things break or errors occur, your customers will not be happy. If you are lucky, your customers send you an email letting you know that things are not working as expected. Unfortunately, many of these occurrences go unreported.
Knowing exactly when things are going wrong is key to keeping your customers happy. This is the problem that monitoring tools solve. They keep an eye on your application, and let you know exactly when things are behaving suboptimally.
Imagine for example that you have an HTTP JSON API. You deploy a new version that changes a bunch of endpoints. Assume it’s infeasible to go through every single route of your application every time you deploy, or to test each endpoint individually with every permutation of input data. That would take far too much time, and it doesn’t scale from an organizational perspective: it would keep engineers constantly context switching between feature work and testing new deployments.
A more scalable solution: briefly smoke test the application after a deployment (as a sanity check), and then use monitoring tooling to pick up on and report on any errors. If your monitoring solution reports that your HTTP JSON API is now responding with 400 or 500 errors, you know you have a problem and you can either rollback the application, or stop it from propagating to across the cluster. The key point is that you can proactively address issues as opposed to being blind to them, and at the same time you can avoid sinking precious engineer time into testing all the things.
While ensuring that production users are not experiencing issues is a huge benefit of application monitoring, there are lots of other benefits. They include:
- Quantifying stress testing results
- Business priority planning based on real usage data
- System performance and capacity planning
Let’s dig into how Prometheus achieves these goals at the technical level.
How Does Prometheus Work?
At its core, Prometheus is a time-series database that enables you to persist metrics in an efficient and performant manner. Once your metrics are in the Prometheus time-series database, you can create alerting rules in Grafana. Those alerts can then be triggered once certain thresholds and criteria are met, letting you know that something has gone wrong.
“But how exactly do my application metrics end up in Prometheus?” Well, your Prometheus instance is configured to scrape all of your configured applications. At a regular interval, each of their instances is queried for metrics data, which is stored in a database. Specifically, it makes a GET HTTP call to /metrics (or wherever your metrics are exposed) and that endpoint will contain a snapshot in time of the state of your application. Once your metrics are in Prometheus, you can query the time-series database with Grafana to plot the data over time; Grafana uses PromQL to refresh data and update its panels.
Given that Prometheus scrapes your applications at a regular interval, the resolution of your time-series data is bound to that interval. In other words, if you get 1,000 requests in the span of 10 seconds, you don’t know exactly at what timestamps those 1,000 requests came in, you just know that you got 1,000 requests in a 10 second time window. While this may seem limiting, it is actually a benefit in disguise. Since Prometheus doesn’t need to keep track of every single timestamp, it is able to store all the time-series data very efficiently.
Luckily with Fly.io, the administration and management of Prometheus can be taken care of for you!
Turning On Prometheus On Fly
Managing, configuring and administering your own Prometheus instance can be a bit of a tall order if you have never worked with Prometheus before. Fortunately, all you need to do to enable Prometheus metrics for your application is add a couple of lines to your fly.toml manifest file. All Fly.io needs to know is what port and path your metrics will be available at. For the TODO List Elixir application for example, the following configuration was all that was needed:
[metrics]
port = 4000
path = "/metrics"
In order to visualize your Prometheus metrics, you’ll need to have an instance of Grafana running somewhere. You could deploy your own Grafana instance on Fly.io by following this guide, but you can also use Grafana Cloud (it has a free plan) — Grafana Cloud works fine with Fly. Which ever route you take, all you then need to do is configure Grafana to communicate with the Fly.io managed Prometheus instance and you are good to go!
Now that we’ve got Prometheus hooked up, we need to get our Elixir application to start providing metrics.
Monitoring Elixir with PromEx
Whenever I write a production-grade Elixir application that needs monitoring, I reach for PromEx.
I wrote PromEx and maintain it because I wanted something that made it easy to manage both the collection of metrics and the lifecycle of a a bunch of Grafana dashboards. That’s to say: PromEx doesn’t just export Prometheus metrics; it also provides you with dashboards you can import into Grafana to immediately get value out of those metrics. I think this is a pretty ambitious goal and I’m happy with how it turned out. Let’s dig in.
At a library design level, PromEx is a plugin style library, where you enable a plugin for whatever library you want to monitor. For example, PromEx has plugins to capture metrics for Phoenix, Ecto, the Erlang VM itself, Phoenix LiveView and several more. Each of these plugins also has a dashboard to present all the captured metrics for you. In addition, PromEx can communicate with Grafana using the Grafana HTTP API, so it will upload the dashboards automatically for you on application start (if you configure it that is). What this means is that you can go from zero to complete application metrics and dashboards in less that 10 minutes!
In the Elixir example application, you can see that the PromEx module definition specifies what plugins PromEx should initialize, and what dashboards should be uploaded to Grafana:
defmodule TodoList.PromEx do
  use PromEx, otp_app: :todo_list

  alias PromEx.Plugins

  @impl true
  def plugins do
    [
      # PromEx built in plugins
      Plugins.Application,
      Plugins.Beam,
      {Plugins.Phoenix, router: TodoListWeb.Router},
      Plugins.PhoenixLiveView
    ]
  end

  @impl true
  def dashboard_assigns do
    [
      datasource_id: "prometheus"
    ]
  end

  @impl true
  def dashboards do
    [
      # PromEx built in Grafana dashboards
      {:prom_ex, "application.json"},
      {:prom_ex, "beam.json"},
      {:prom_ex, "phoenix.json"},
      {:prom_ex, "phoenix_live_view.json"}
    ]
  end
end
With a little bit of configuration in runtime.exs PromEx can communicate with Grafana to take care of the graph annotations and dashboard uploads:
config :todo_list, TodoList.PromEx,
  manual_metrics_start_delay: :no_delay,
  grafana: [
    host: System.get_env("GRAFANA_HOST") || raise("GRAFANA_HOST is required"),
    auth_token: System.get_env("GRAFANA_TOKEN") || raise("GRAFANA_TOKEN is required"),
    upload_dashboards_on_start: true,
    folder_name: "Todo App Dashboards",
    annotate_app_lifecycle: true
  ]
With the managed Prometheus instance from Fly.io, and the metrics collection from PromEx, you have an instrumented application in record time! Here are some snapshots from the auto generated dashboards for the Todo List application:
And That’s It!
Elixir makes it easy to run ambitious, modern applications that take advantage of distributed computing. It should be just easy easy to see what those applications are actually doing, and to have alerts go off when they misbehave. Between Fly.io’s built-in Prometheus and the PromEx library, it’s easy to get this kind of visibility. Your application can be instrumented with dashboards and annotations in a coffee break’s worth of time.
Be sure to check out the Todo List application Repo for more technical details and all the code necessary to do this yourself. What used to take a few days to set up and run, now only takes a few hours, so be sure to give it a test drive!
You can launch an observable Elixir app on Fly.io in minutes
Fly.io is one of the easiest ways to take advantage of Elixir community libraries like prom_ex, so you can run your application and watch what it’s actually doing, with pretty graphs to impress people looking over your shoulder in the cafe!
Deploy your Elixir App! →