
Fly apps include built in Prometheus instrumentation – monitor performance, create alerts, and even export your own metrics. If you haven’t taken Fly for a spin, now’s a good time: if you’ve got a Docker container, it can be running on Fly in single-digit minutes.
We’ve written a bit, for a general audience, about how Fly collects and manages metrics. If you’re just sort of generally interested in metrics and observability, go read that first.
Meanwhile, if you’re a Fly user, or considering becoming such a user, here’s the deal:
All Fly apps now include built-in Prometheus metrics. We give you a bunch of useful metrics automatically, and we’ll walk through some of them here. More importantly: you can export your own custom metrics. And you should export your own custom metrics, because metrics are supremely useful. We’ll talk a bit about that, too.
A Quick Overview Of Metrics At Fly
This is one of those “pictures worth a thousand words” scenarios, so, without further ado, here’s some metrics:
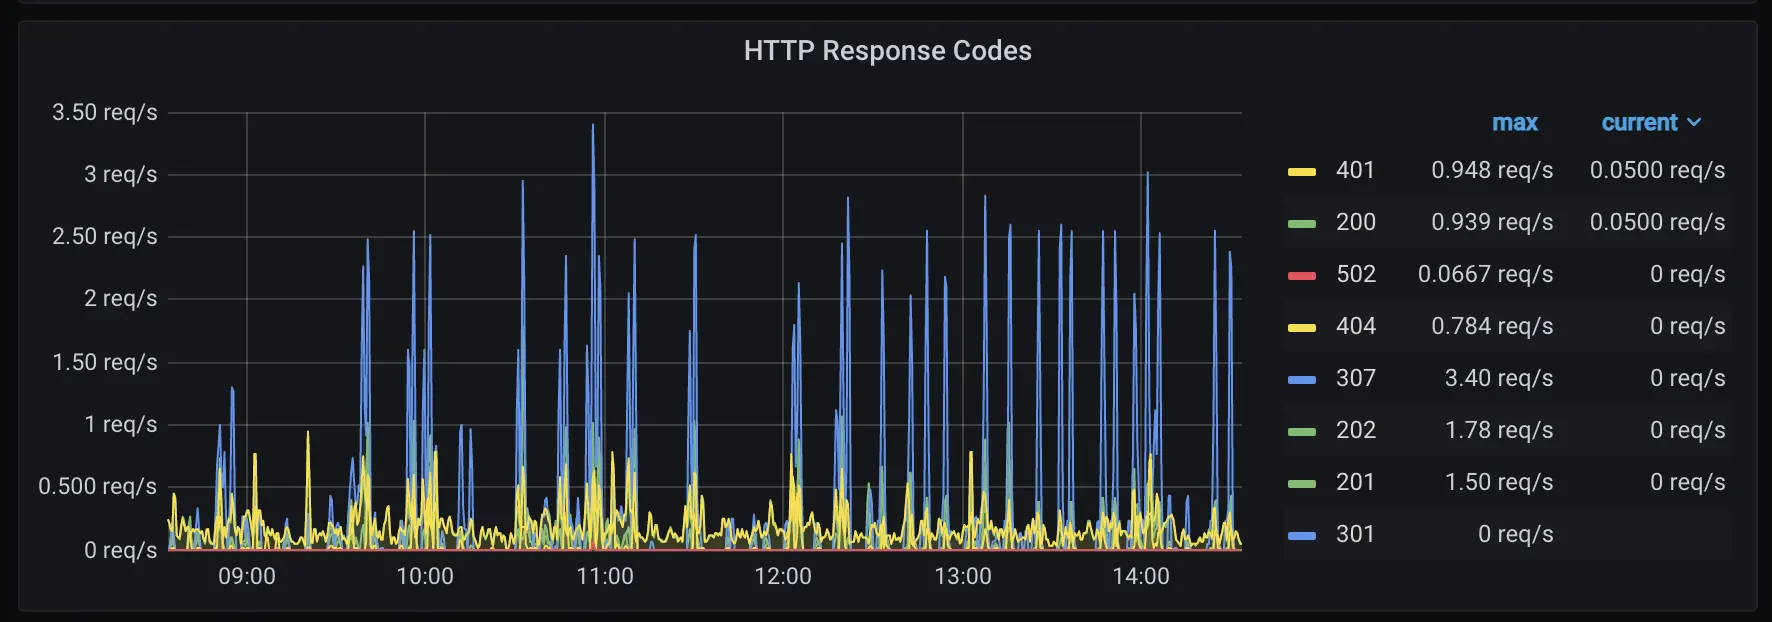
Over the last 30 minutes, for each HTTP response code our app generated, these are the requests per second we’re seeing.
Fly tracks a bunch of metrics like this for you, and you can add your own. We use a Prometheus-style system to do this, and a Prometheus endpoint is part of our public API.
There’s not a lot you need to know about Prometheus before diving in. It’s enough to know that Prometheus metrics have names and labels, and that there are for the most part 3 kinds:
- Counters, by far the most important kind, are strictly increasing; they’re simply a number you bump every time an event occurs. The counter
fly_edge_http_responses_countcounts every HTTP response our proxy handles for you; it includes labels likeappandregion. - Gauges vary up and down; think of them like the speedometer on your car. Prometheus strongly favors counters over gauges, in part because if you miss a measurement or two, a counter loses resolution, but a gauge might lose data — it could, for instance, hide a burst of traffic that occurred during the missed measurements.
- Histograms break data out into buckets. Histograms are generally how you make heatmaps for metrics. You’ll see in a minute.
You query Prometheus using its query language, PromQL. If you’ve used the command-line tool jq, you have a bit of the flavor of PromQL; just think of a jq that specializes in being a programmable calculator. You can read PromQL tutorials, but also like jq, you can get by with just a small subset of it, which is how we’re going to tackle this walkthrough.
Most people use Prometheus with a graphical front-end, and by far the most popular front-end for Prometheus metrics is Grafana, which is what we’re going to use here. You can run your own instance of Grafana (it works fine as a Fly app), or you can sign up for a free Grafana Cloud account.
Getting Fly Metrics Into Grafana
Easy! Get a working Grafana somewhere. Now, run flyctl auth token to retrieve a Fly token. In Grafana’s “Configuration” menu, the first option is “Data Sources”. We’re one of those.
“Add data source”, and pick Prometheus; it should be the first option. The URL for Fly’s Prometheus is per organization. Your personal organization is https://api.fly.io/prometheus/personal, other organizations are https://api.fly.io/prometheus/<name>. Turn off all the authentication options, and then add a “Custom Header”; make it Authorization, and make the value Bearer <token>.
Save the data source; Prometheus will check it and make sure it works for you. If you get the green light, you’re good to go.
A Basic Fly Dashboard
We set up a simple, clean dashboard with a bunch of graphs on it, and you can pull it directly into your Grafana instance. Go to “Manage Dashboards”, click “Import”, and then paste in the JSON from this Github link.
Grafana has a whole community site for dashboard JSONs like this, and when we figure out how it works, we’ll try to get ours on it.
Now, let’s take a tour of the dashboard and see how it works.
The first thing we want you to notice is the app picker at the top left of the screen. The picker fetches the fly_app_concurrency metric from our API to get a list of your apps, which is stored in the $app variable exposed to all the queries on this dashboard.
If you can’t tell, we’re assuming you’re not super familiar with Grafana, so the other thing we’ll point out is that there’s a picker on the other side of the screen that determines the time scale of the metrics we’re looking at. You’re probably looking at 15 minutes worth of data, and you should know you can dial that up or down.
Now, a simple graph:
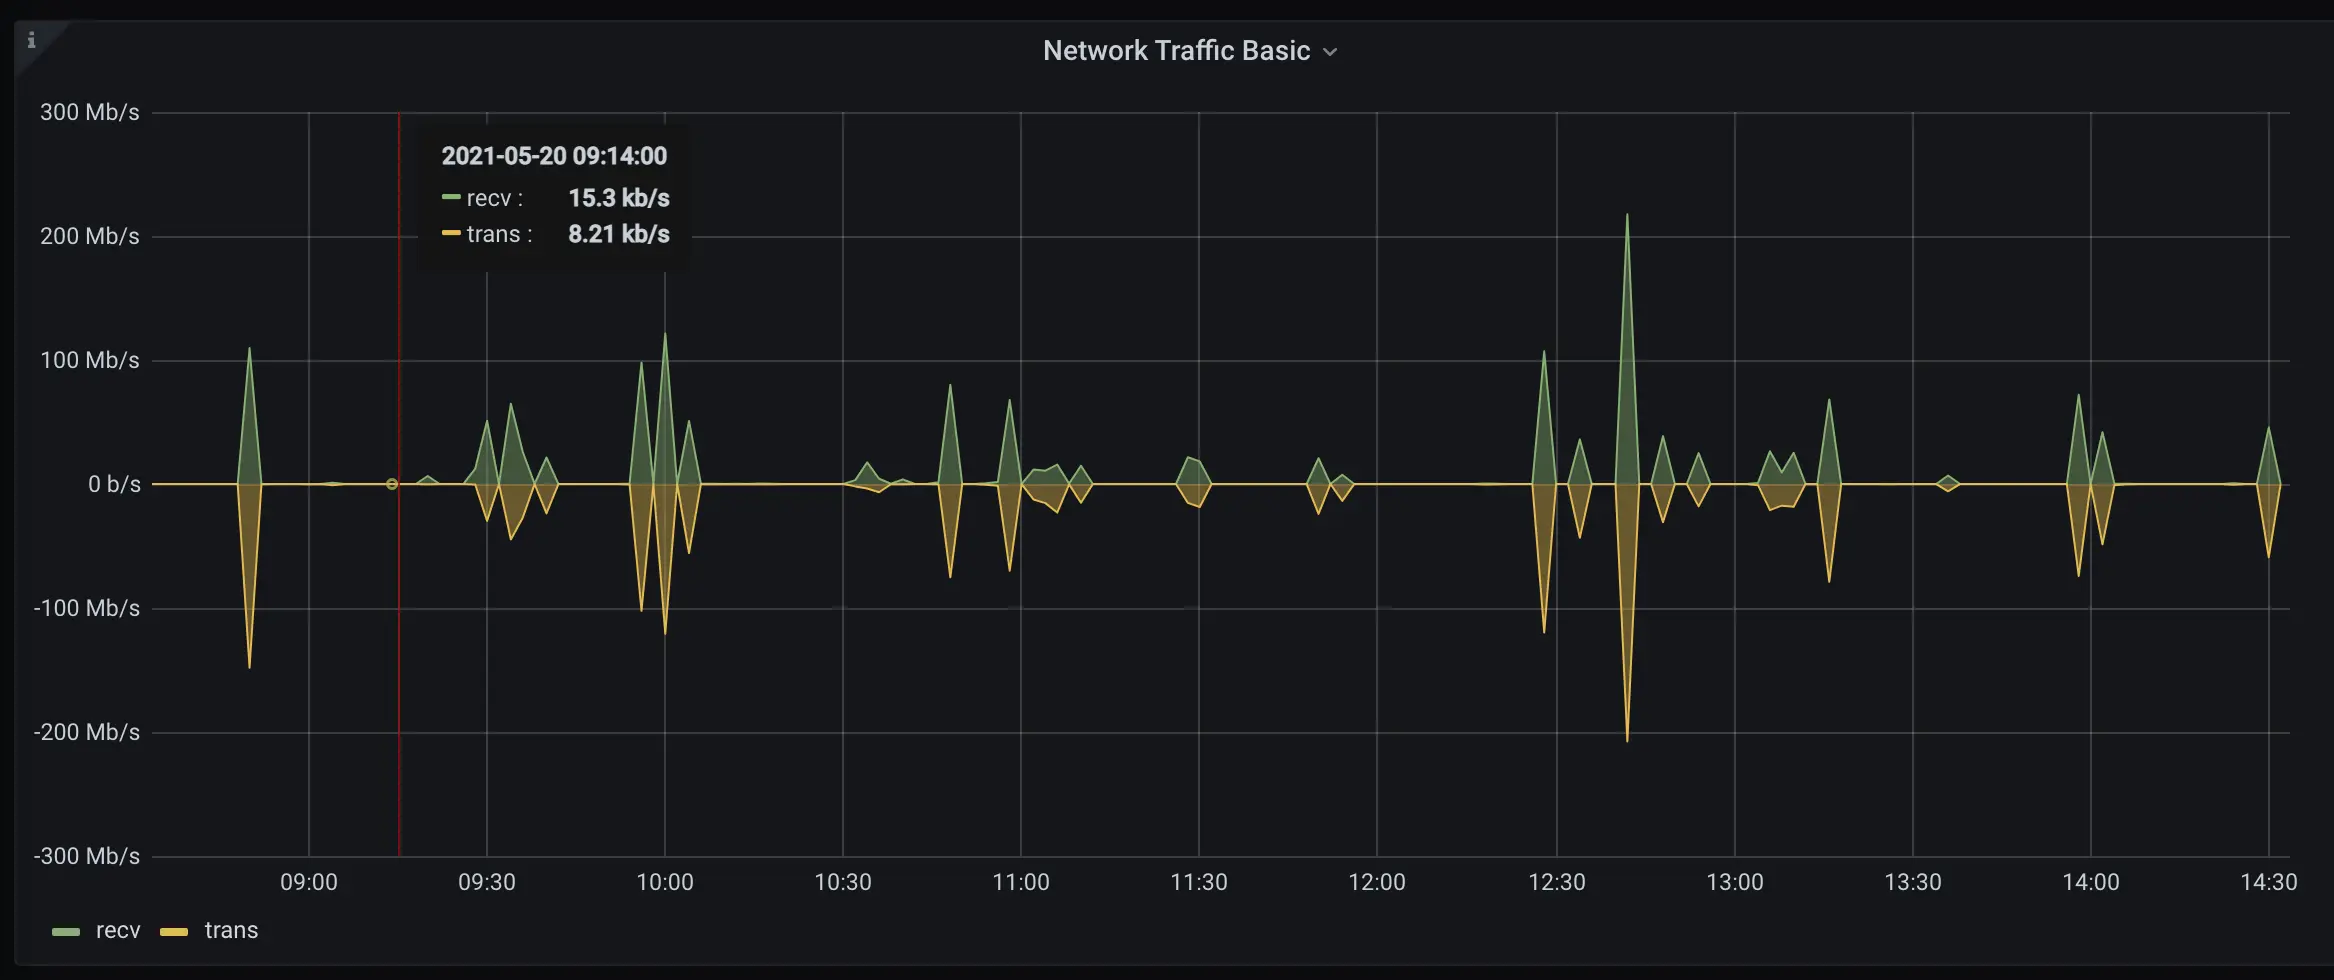
If you click next to the title on this graph, there’s a drop-down you can use to edit it. Do that and you’ll see the queries we’re using:
sum(irate(fly_instance_net_recv_bytes{app="$app"}[5m])*8)
sum(irate(fly_instance_net_sent_bytes{app="$app"}[5m])*8)
fly_instance_net_(recv|sent)_bytes is a counter and works the way you’d think it would. app=“$app” narrows us down to just the metrics matching our current app. You could add , region=“ord" to the expression to narrow us down to metrics from Chicago, and now you basically get the idea for how names and labels work.
We add [5m] to the query to fetch a window of 5 minutes worth of metrics from, and then irate() to get the rates of increase from the raw counter values (you’ll see irate, rate, and increase in almost every Prometheus counter query, and they all do roughly the same thing in slightly different ways). Remember, Fly’s systems are scraping your metrics at some interval and generating vectors of counters, and PromQL’s job is generally to turn those raw values into intelligible time-series information.
Finally, we sum() across all the available metrics we have that match this query, and convert to bits.
On the right hand pane in the Grafana pane editor you can see that we have this set up as a line graph, and you can click around and muck with those settings if you like. Try switching “stack” on to see TX/RX superimposed. Have fun. Meanwhile, we’re moving on.
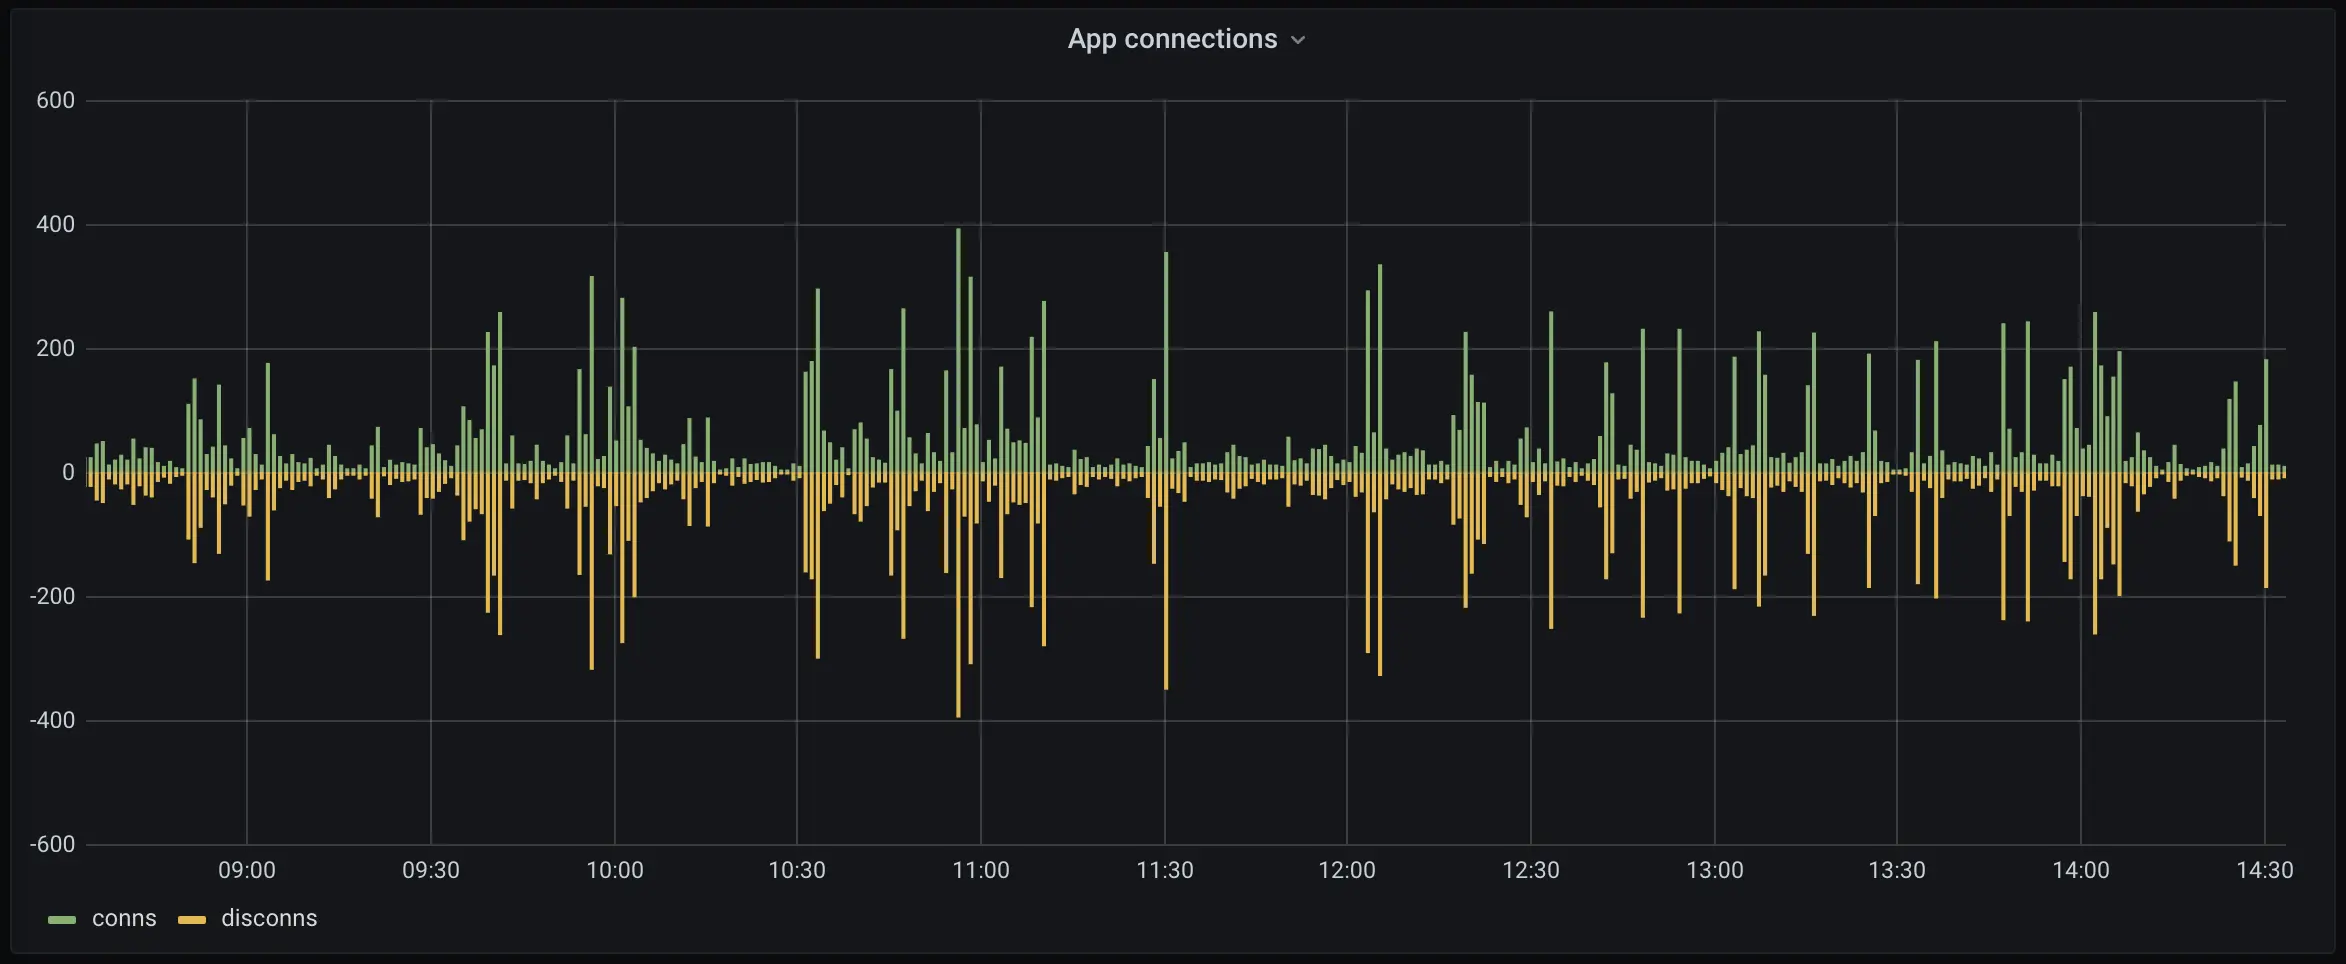
Connections aren’t much more complicated.
sum(increase(fly_app_tcp_connects_count{app="$app"}[$__interval]))
sum(increase(fly_app_tcp_disconnects_count{app="$app"}[$__interval]))
fly_app_tcp_(connects|disconnects)_count do what they say on the tin. We use increase here because Jerome is fussy (“I always use increase for bar charts”, he tells me); $__interval is a Grafana-ism for, roughly, “have Grafana figure out the right interval”.
Now, let’s get ambitious:
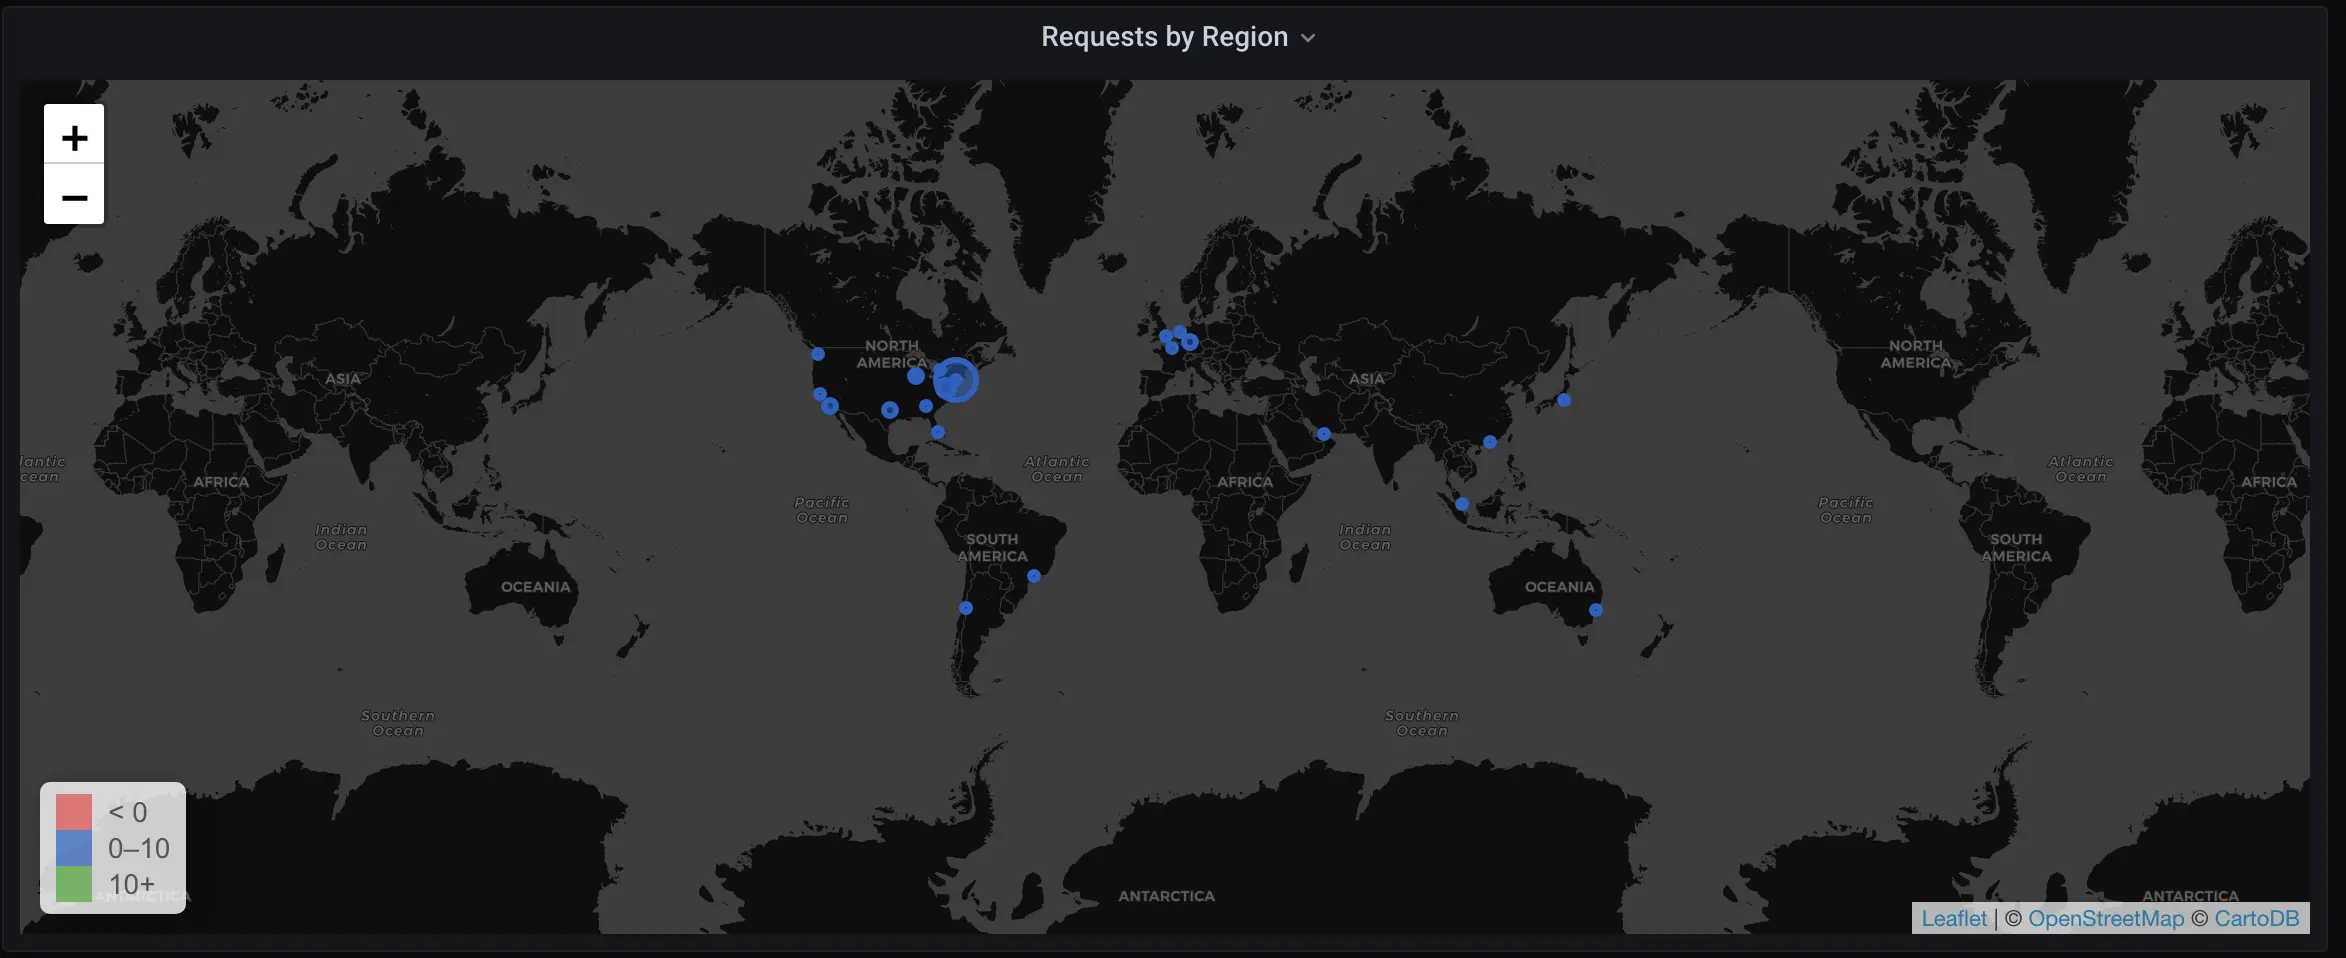
Check out all its majesty.
The query here is actually very simple:
sum(rate(fly_edge_http_responses_count{app=~"^$app$"}[$__interval])) by (region)
You’ve seen almost all of this before. Note that instead of summarizing all available metrics onto one line, we instead break them out by (region) (and set the legend for each data point accordingly).
We use the “World Map” visualizer in Grafana to render this. The visualizer accepts a URL for keyed map location data, and, wouldn’t you know it, our public API has just such a URL endpoint, at https://api.fly.io/meta/regions.json. The map visualizer matches the region in our metrics to the key in each row of the JSON our endpoint returns, and that’s basically it.
One more graph we want to walk through; this is a good one:
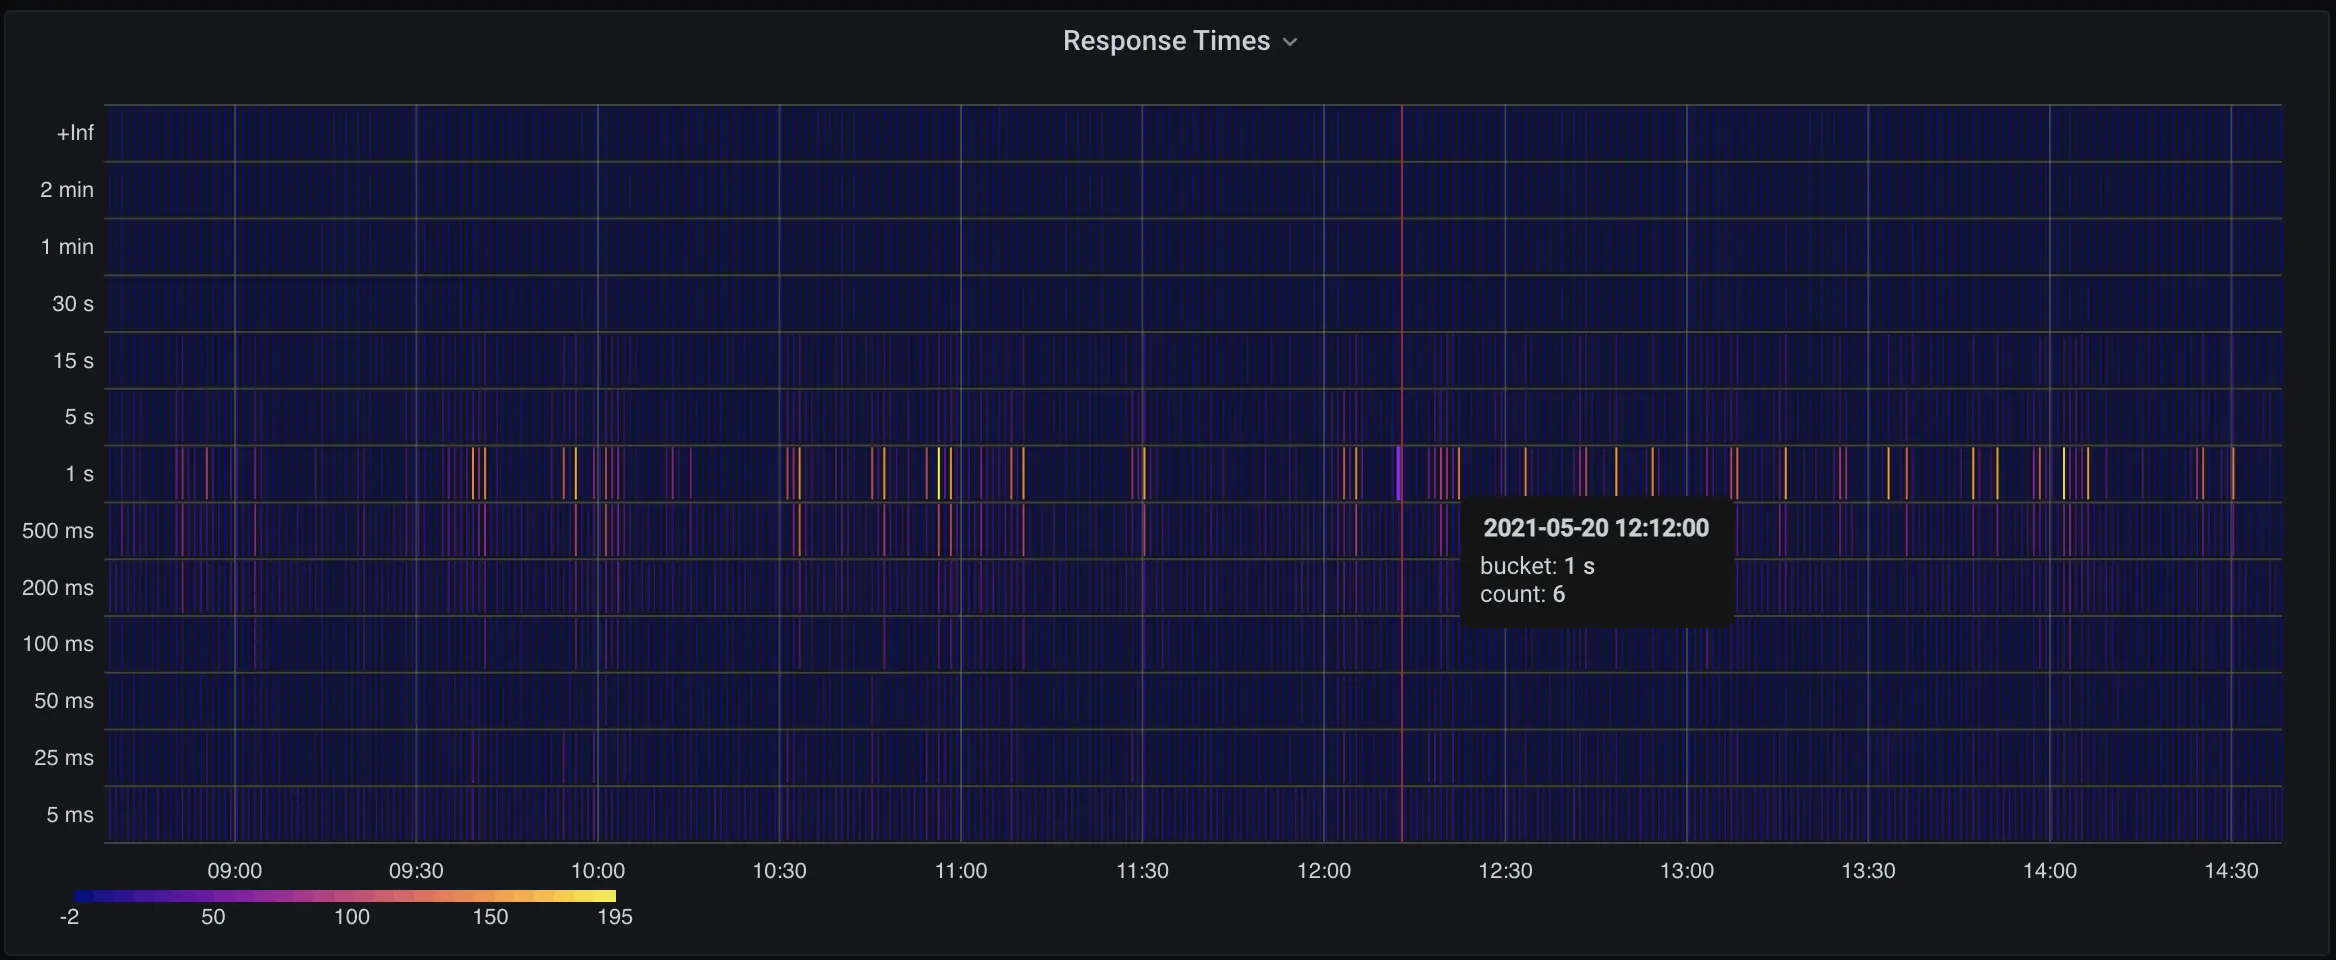
I don’t know about you, but I feel smarter just having this on my screen.
And the query:
sum(increase(fly_edge_http_response_time_seconds_bucket{app=~"^$app$"}[$__interval])) by (le)
fly_edge_http_response_time_seconds_bucket is a histogram, which is a bucketed stat; the buckets here are indicated by le.
As the Fly Proxy tracks this metric, it bumps one of a collection of counters; we break them out as 5ms, 25ms, 50ms, 100ms, 200ms, 500ms, 1s, 5s, 15s, and, god help you, 30s, 60s, and 120s. This is fussier than the typical Prometheus metric, which is a simple global counter, but it supports a graph pretty much every wants: “how scary have my response times looked over the last N hours”.
Grafana has a nice heatmap that you can drive with Prometheus histograms, and we’re not doing anything interesting with its settings.
Generate Your Own Metrics
Fly provides a bunch of built-in metrics, but you don’t have to (and shouldn’t) stick with just ours. If you export metrics from your application in Prometheus format, we’ll pick them up, index them in our TSDB, and serve them to things like Grafana over our public API.
For instance, let’s say we have a Go application running on Fly. We can:
import (
   //...
   // import prometheus
    "github.com/prometheus/client_golang/prometheus"
    "github.com/prometheus/client_golang/prometheus/promhttp"
)

//...
// create a counter variable
counter := prometheus.NewCounterVec(prometheus.CounterOpts{
        Subsystem: "someEvent",
        Name:      "count",
    }, []string{"label", "other-label"})
prometheus.MustRegister(counter)

//...
// serve prometheus metrics
http.Handle("/metrics", promhttp.Handler())

//... later
// bump the counter when something happens
counter.With(prometheus.Labels{"label": "something"}).Inc()
You can export stats on the default Go HTTP handler (they’ll be exposed) or on a private handler on a different port or address; either way, you tell us about your metrics in fly.toml:
[metrics]
    port = 8080
    path = “/metrics”
When you deploy, we’ll start scraping, and whatever stats you’ve defined will show up in Grafana.
Not a Golang person? Here’s what it looks like in Python Flask:
from flask import Flask, request
from prometheus_flask_exporter import PrometheusMetrics

app = Flask(__name__)
metrics = PrometheusMetrics(app)

@app.route('/event/<event_type>')
@metrics.counter('events_by_type', 'Number of events by type',
         labels={'event_type': lambda: request.view_args['event_type']})
def hello_event(event_type):
    return 'You have been recorded.'

@metrics.do_not_track()
@app.route('/')
def hello_world():
    return 'Hello, World!'
The prometheus_flask_exporter gets you a couple useful metrics by default, without you doing anything, and, also by default, listens on /metrics.
Node.js? No problem:
const express = require(‘express’)
const app = express()
const port = 3000

const prom = require(‘express-prometheus-middleware’);

app.use(prom({
  metricsPath: ‘/metrics’,
  collectDefaultMetrics: true,
}));

app.get(‘/‘, (req, res) => {
  res.send(‘Hello World!’)
})

app.listen(port, () => {
  console.log(`Example app listening at http://localhost:${port}`)
})
Hopefully we’re beginning to see a theme here. If you’re using any mainstream framework, adding metrics is going to be a very short project for you.
Remember, part of the idea behind Prometheus’s counter-first mentality is that counters are super cheap. They’re cheaper both to generate and to track than log lines are; think about them the same way, and instrument your application so you have a decent idea of what it’s getting up to.
And There You Go
Like everything else on our platform, we want reasonable metrics to be so simple that it’s boring. They should just work. Even if you do nothing at all, we’re generating metrics you can pull into Grafana, watch graphs for, and alert on.
Prometheus metrics are free right now. Some tier of them will be free forever. You should know that if you get super ambitious with metrics, we’ll eventually have a pricing plan for them — the TSDB that backs metrics costs us operationally to manage and scale. But we’ll keep things simple and cost-effective, because we want all of you to instrument your applications.