---
title: "Custom Laravel Pulse Cards"
description: "Record and aggregate custom Pulse Metrics, and display in a custom Pulse Card!"
---
# Custom Laravel Pulse Cards

[Annie Ruygt](https://annieruygtillustration.com/)
Fly.io converts Docker images to fast-booting VMs and runs them globally. Fly.io supports [Laravel](https://docs.fly.io/laravel)! Check us out.
[Pulse](https://pulse.laravel.com/) delivers a dashboard of application metric cards. Beyond these are reusable templates and a record-and-aggregation system to help us craft custom cards tailored to our very needs.
## A Custom Requirement: Requests Per Machine
[In a previous article](https://fly.io/laravel-bytes/laravel-pulse-machines/), we configured our [Fly Machines](https://docs.fly.io/machines) to run `pulse:check` to capture and display data for the [Pulse `servers` card](https://laravel.com/docs/10.x/pulse#servers-card). This gave us insight into the CPU, Memory, and Storage usage of each of the Fly Machines serving our application:
|  |
| --- |
| Two Fly Machines’ server metrics are listed in Pulse’s `servers` card. |
This time around, we want to display a card tallying requests received by each Fly Machine. Since Laravel Pulse doesn’t have a default card to display this information, we’ll have to create our own card for this.
*And* get this. We won’t have to create our card from scratch. Pulse enables us to create custom cards built on top of its Livewire [`Card` component,](https://github.com/laravel/pulse/blob/1.x/src/Livewire/Card.php) *and* its data recording and aggregation system.
Let’s dive in!
## Displaying a New Card
Pulse’s cards are [built](https://laravel.com/docs/10.x/pulse#custom-cards) using [Livewire.](https://livewire.laravel.com/) To display a custom Pulse card, all we have to do is create a new Livewire component that extends Pulse’s base[Livewire Card component](https://github.com/laravel/pulse/blob/1.x/src/Livewire/Card.php):
```
/* app/Livewire/RequestsReceived.php */
namespace App\Livewire;
+ use Laravel\Pulse\Livewire\Card;
+ class RequestsReceived extends Card
{
public function render()
{
return view('livewire.requests-received');
}
}
```
In creating the corresponding view displaying our card, we’ll take plenty inspiration from Pulse’s available cards. We’ll use existing pulse [blade components](https://laravel.com/docs/10.x/pulse#custom-cards:~:text=your%20Pulse%20card%27s-,corresponding%20view,-%2C%20you%20may%20leverage) for a similar look and feel with the rest of the dashboard:
This blade component can receive parameters like `cols` and `rows` to determine the spatial division of the card.
`class` is also available to allow us to specify additional classes we’d want to map to the component.
```
Display table Showing requests per Machine
```
Finally, include this card in our pulse dashboard view so we can glimpse it:
```
/*resources/views/vendor/pulse/dashboard.blade.php */
+
```
## Data to Display
Of course, the card currently has no data to display yet. Remember, we want info on the requests received by each machine. To display that information, we have to first get a hold of it.
We can retrieve this in two ways: using [Fly.io’s metrics API](https://docs.fly.io/monitoring/metrics#querying) or manually capturing requests and recording them using Pulse’s recording system.
That’s right! Fly.io provides access to [metrics](https://docs.fly.io/monitoring/metrics)about our application running on its platform. We can query this info with a call to the [Fly endpoint](https://docs.fly.io/monitoring/metrics#querying) and display it in our Pulse Card. [Here’s a repository](https://github.com/fly-apps/laravel-pulse-card-fly-metrics) which displays metrics from the [Fly.io Metrics API](https://github.com/fly-apps/laravel-pulse-card-fly-metrics/blob/d9f16986f6182e0f8848645a618794bbfe71ef8a/app/Fly/MetricsApi.php#L17) in a custom Pulse card.
On the other hand, we can also capture requests received by our Fly Machines manually. Then we record these through Pulse’s data capture and aggregation system, *then* display that. Yup, that’s what we’re doing today.
## Capturing Metrics with Pulse
To record requests per Machine via Pulse, we have to first intercept all requests, and capture the Fly Machine ID that receives each request.
To do so, we create a [global middleware](https://laravel.com/docs/10.x/middleware#global-middleware) from where we install our recording logic:
```
/* app/Http/Middleware/RecordRequest.php */
use Closure;
use Illuminate\Http\Request;
use Symfony\Component\HttpFoundation\Response;
+ use Laravel\Pulse\Facades\Pulse;
class RecordRequest
{
public function handle(Request $request, Closure $next): Response
{
+ $machineId = config(
'pulse.recorders.'
.\Laravel\Pulse\Recorders\Servers::class.'.server_name'
);
+ Pulse::record('machine_requests', $machineId, null )
+ ->count();
return $next($request);
}
}
```
Above we first identify the Machine that received the request. We do this [the same way](https://github.com/laravel/pulse/blob/801ec40e7d31ecccf6a0f14a684baaf8dfb6a1ea/src/Recorders/Servers.php#L42) `Pulse` identifies it: through the [Pulse config `server_name`](https://github.com/laravel/pulse/blob/801ec40e7d31ecccf6a0f14a684baaf8dfb6a1ea/config/pulse.php#L166) value. This would by default resolve in the Machine ID, which we pass to our `$machineId` variable.
We pass this along with two other attributes to Pulse’s `record()` [method](https://github.com/laravel/pulse/blob/801ec40e7d31ecccf6a0f14a684baaf8dfb6a1ea/src/Pulse.php#L144). **“machine_requests”** is what we’d want to identify the custom metric we want to record ( `type` of metric we want Pulse to keep track of ). **$machineId** identifies that the request was for a specific Machine ID ( `key` we can group entries of a specific `type` with ). Finally, **null** for the third to indicate no specific `value` to associate with the entry.
Looking at the repository of the Pulse package, it can be ascertained that a call to the `Pulse::record()` [method](https://github.com/laravel/pulse/blob/801ec40e7d31ecccf6a0f14a684baaf8dfb6a1ea/src/Pulse.php#L144) [eventually](https://github.com/laravel/pulse/blob/801ec40e7d31ecccf6a0f14a684baaf8dfb6a1ea/src/Pulse.php#L162) [creates](https://github.com/laravel/pulse/blob/801ec40e7d31ecccf6a0f14a684baaf8dfb6a1ea/src/Pulse.php#L365) [a](https://github.com/laravel/pulse/blob/801ec40e7d31ecccf6a0f14a684baaf8dfb6a1ea/src/Pulse.php#L305) [new](https://github.com/laravel/pulse/blob/801ec40e7d31ecccf6a0f14a684baaf8dfb6a1ea/src/Contracts/Ingest.php#L14) [record](https://github.com/laravel/pulse/blob/801ec40e7d31ecccf6a0f14a684baaf8dfb6a1ea/src/Ingests/StorageIngest.php#L29) in the [`pulse_entries`](https://github.com/laravel/pulse/blob/801ec40e7d31ecccf6a0f14a684baaf8dfb6a1ea/src/Storage/DatabaseStorage.php#L101) table:
| timestamp | type | key | key_hash | value |
| --- | --- | --- | --- | --- |
| 1706711201 | machine_requests | 4d8966da01e5d8 | `` | null |
Next, inspect the `count()` [method](https://github.com/laravel/pulse/blob/801ec40e7d31ecccf6a0f14a684baaf8dfb6a1ea/src/Entry.php#L34) which is chained to the statement. This will result in the creation/update of a [row](https://github.com/laravel/pulse/blob/801ec40e7d31ecccf6a0f14a684baaf8dfb6a1ea/src/Storage/DatabaseStorage.php#L178) in the [`pulse_aggregates`](https://github.com/laravel/pulse/blob/801ec40e7d31ecccf6a0f14a684baaf8dfb6a1ea/src/Storage/DatabaseStorage.php#L180) table which stores the [computed](https://github.com/laravel/pulse/blob/801ec40e7d31ecccf6a0f14a684baaf8dfb6a1ea/src/Storage/DatabaseStorage.php#L285) count [aggregate value](https://github.com/laravel/pulse/blob/801ec40e7d31ecccf6a0f14a684baaf8dfb6a1ea/src/Storage/DatabaseStorage.php#L185) associated with [a combination of columns](https://github.com/laravel/pulse/blob/801ec40e7d31ecccf6a0f14a684baaf8dfb6a1ea/database/migrations/2023_06_07_000001_create_pulse_tables.php#L68) [grouping](https://github.com/laravel/pulse/blob/801ec40e7d31ecccf6a0f14a684baaf8dfb6a1ea/src/Storage/DatabaseStorage.php#L180) our entry above:
| bucket | period | type | key | key_hash | aggregate | value | count |
| --- | --- | --- | --- | --- | --- | --- | --- |
| 1706712600 | 60 | machine_requests | 4d8966da01e5d8 | `` | count | 1 | null |
Notice there’re some similarly named columns in both tables above. Their `type`, `key`, and `key_hash` seem to hold the same values. However, their `value` columns differ quite greatly. The `pulse_entries` use it for the [value](https://github.com/laravel/pulse/blob/801ec40e7d31ecccf6a0f14a684baaf8dfb6a1ea/src/Entry.php#L160) attribute passed during the call to `record()`. While `pulse_aggregates` stores the result of an [aggregation computation](https://github.com/laravel/pulse/blob/801ec40e7d31ecccf6a0f14a684baaf8dfb6a1ea/src/Storage/DatabaseStorage.php#L184) into `value`.
With this setup, every request will create( or update ) records in the `pulse_entries` and `pulse_aggregates` tables. Each new request per machine will be recorded as individual data points in the `pulse_entries` table. And thanks to `count()`, we get an easy-to-retrieve count aggregate values for each Machine’s request tally in the `pulse_aggregates` table. Finally, we can display this information in our Pulse Card.
## Retrieving Pulse Metrics
We now have our requests recorded in our Pulse tables above. What we want next is to display the captured information in our custom Pulse card.
First, let’s retrieve our entries for our custom `"machine_requests"` metric type by calling `Pulse's` `aggregate()` method:
```
/* app\Livewire\RequestsReceived.php */
public function render()
{
return view('livewire.requests-received',[
+ 'machines' => $this->aggregate(
'machine_requests',
['count']
)
]);
}
```
The `aggregate()` method receives two parameters. The first identifies the `type` of metric entries we’d want to retrieve, in which case we indicate a “machine_requests”. The second attribute lists out the aggregate values we want from each item in the retrieved list of entries. This for us is the `count` aggregate, as this will tell us the count of requests per machine at a given period of time.
We pass the resulting data received from the `aggregate()` call to a variable `$machines` accessible in our blade. This will allow us to display the list of Machines and their relevant request count in our corresponding view:
```
@foreach( $machines as $machine )
{{ $machine->key }} = {{ $machine->count }}
@endforeach
```
Annd finally we get this:
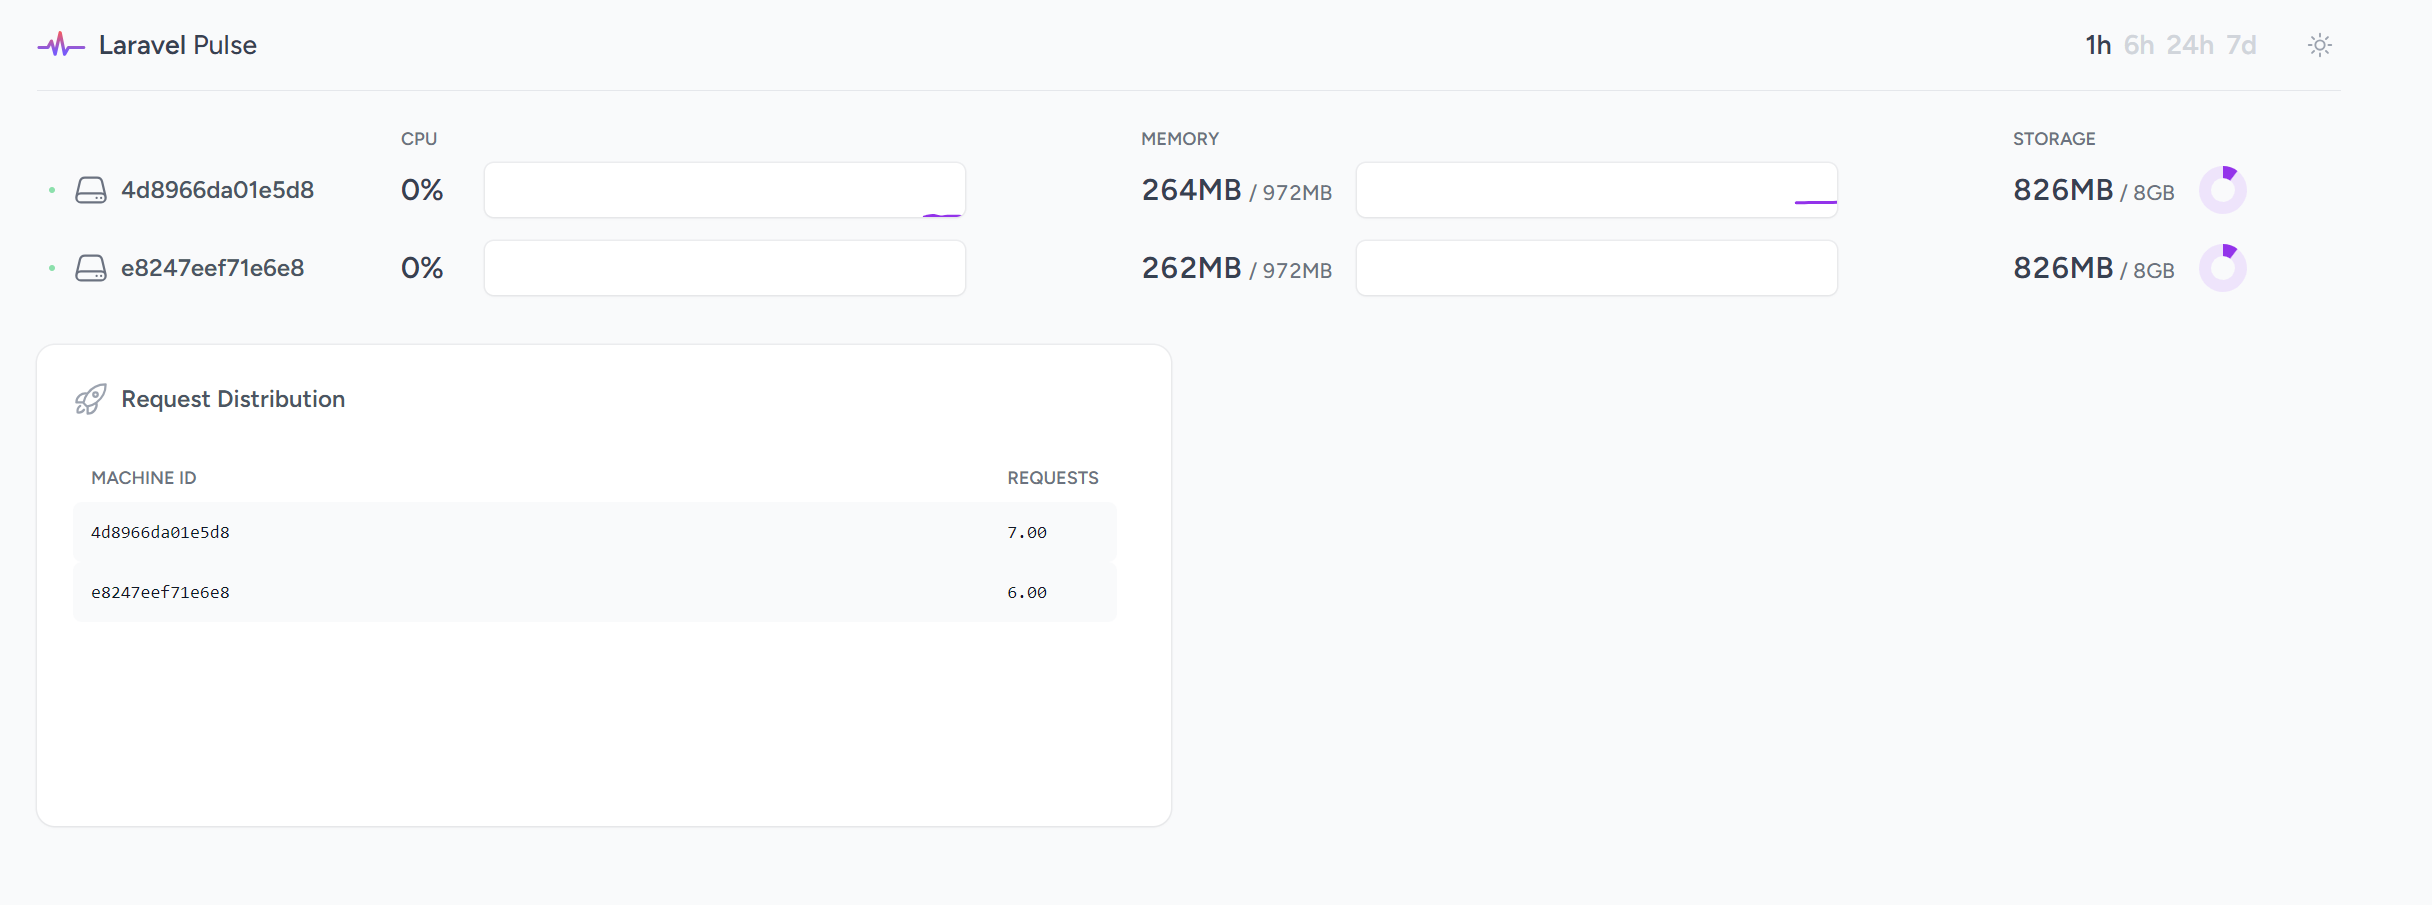
Our very own, custom request-per-machine metrics, in our very own Pulse card! For a closer look into the different code snippets used above, do check out this [sample repository](https://github.com/KTanAug21/example-custom-pulse-card) here!
## Fly.io ❤️ Laravel
Fly your servers close to your users—and marvel at the speed of close proximity. Deploy globally on Fly in minutes!
[Deploy your Laravel app! →](https://docs.fly.io/laravel)
## The Happenings Above
We needed a custom metric displayed in our Pulse dashboard, so we did a bunch of things.
First we captured requests by creating a global middleware and enclosing our recording logic on it using Pulse’s `record()` and `count()` methods. We then retrieved these metrics from Pulse’s database tables by calling Pulse’s `aggregate()` method. Finally, we displayed the information captured by extending Pulse’s custom Card component and making use of its existing blade components to follow after the default Pulse card theme.
With just three sections, we’ve got our very own custom Pulse metrics recorded to our needs, and displayed in our Pulse dashboard. Of course, this is a very basic rundown of the creation of Custom Pulse Cards. Please do read more about the different facets of the package’s custom cards from its [official, wonderful documentation](https://laravel.com/docs/10.x/pulse#custom-cards).